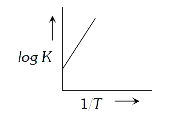
A
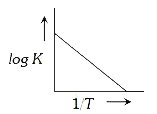
B
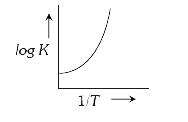
C
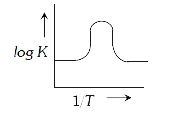
D
Text Solution
Verified by Experts
The correct Answer is:


Similar Questions
Explore conceptually related problems
Recommended Questions
- A graph plotted between log k versus 1//T for calculating activation e...
Text Solution
|
- A graph plotted between log k versus 1//T for calculating activation e...
Text Solution
|
- The graph between log k versus 1//T is a straight line.
Text Solution
|
- The slope of a line in the graph of log k versus 1/T for a reaction is...
Text Solution
|
- When a plot of log k versus 1//T of chemical reaction is made, the ene...
Text Solution
|
- सक्रियण ऊर्जा की गणना के लिए log k Vs. 1/T के बीच ग्राफ पदर्शित किया ज...
Text Solution
|
- Rate constant k of a reaction varies with temperature according to the...
Text Solution
|
- A graph plotted between log k versus 1//T for calculating activation e...
Text Solution
|
- A graph plotted between log k versus 1//T for calculating activation e...
Text Solution
|