A
B
C
D
Text Solution
Verified by Experts
The correct Answer is:


Similar Questions
Explore conceptually related problems
Recommended Questions
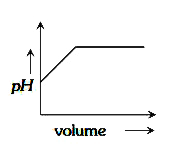
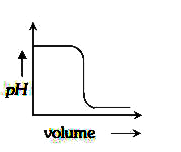
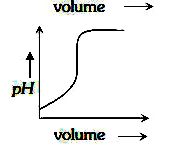
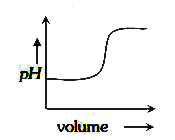
- Which of the following plot represents the graph of pH against volume ...
Text Solution
|
- The following graph represents the titration of pH vs volume
Text Solution
|
- Which one of the following curves represents the graph pH during the t...
Text Solution
|
- which one of the following curves represents the graph of pH dur...
Text Solution
|
- 50 cm^(3) of 0.2 N HCl is titrated against 0.1 N NaOH solution. The ti...
Text Solution
|
- Which of the following plot represents the graph of pH against volume ...
Text Solution
|
- 50 cm^(2) of 0.2 N HCl is titrated against 0.1 N NaOH solution. The ti...
Text Solution
|
- 50 mL of 0.2 N HCl is titrated against 0.1 N NaOH solution. The titrat...
Text Solution
|
- A 100ml solution of 0.1 N HCl was titrated with 0.2N NaOH solution. Th...
Text Solution
|