


CBSE MODEL PAPER-Additional Practice Questions-Question
- The circuit below consists of a variable resistor connected in series ...
Text Solution
|
- The frequency of AC in some countries is 60 Hz. What does this mean?
Text Solution
|
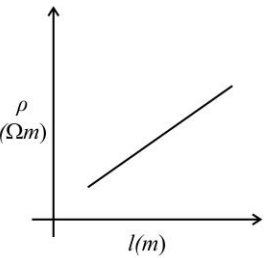
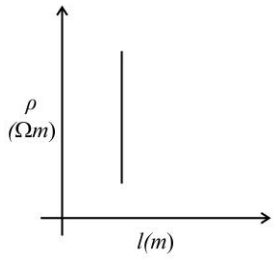
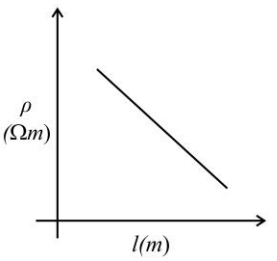
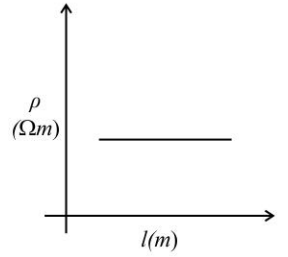
- Raman wants to draw a graph to show how the resistivity (rho) of a wir...
Text Solution
|
- Which circuit shows the correct and safe positions for the fuse and th...
Text Solution
|
- Q. no 20 is Assertion - Reasoning based questions. These consist of ...
Text Solution
|
- White light is passed through a prism to yield a spectrum. (a) The r...
Text Solution
|
- Myopia is also known as near-sightedness. A person with this defect ha...
Text Solution
|
- (a) A lens forms a blurred image of an object on the screen as shown b...
Text Solution
|
- Sunita had to replace the electrical plug of her clothes iron. She bou...
Text Solution
|
- Sunita had to replace the electrical plug of her clothes iron. She bou...
Text Solution
|
- P and Q represent two straight wires carrying equal current (I) in a d...
Text Solution
|