


Similar Questions
Explore conceptually related problems
Recommended Questions
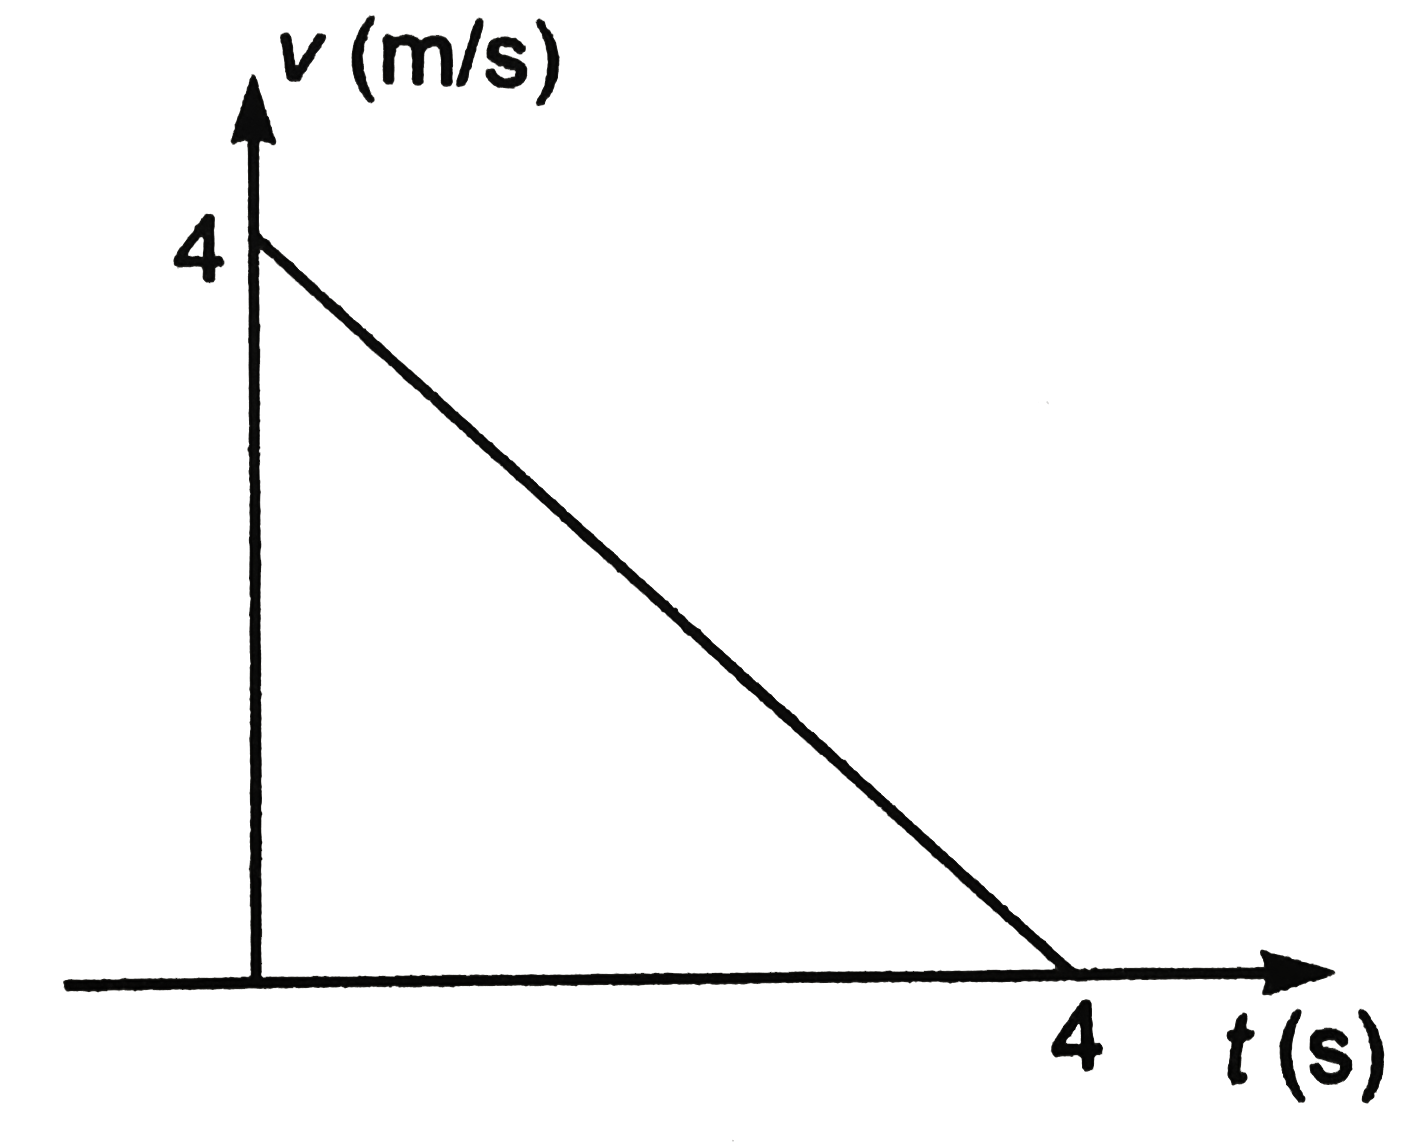
- The velocity- time graph of the figure shown the motion of a wooden bl...
Text Solution
|
- The velocity- time graph of the figure shown the motion of a wooden bl...
Text Solution
|
- A bullet of mass 'm' moving with velocity 'u' passes through a wooden ...
Text Solution
|
- A block of mass 2 kg is given a push for a moment horizontally and the...
Text Solution
|
- Blocks are given velocities as shown at t=0, find velocity and positio...
Text Solution
|
- Velocity time graph for the motion of a particle along a straight line...
Text Solution
|
- Velocity -time graph for a body of mass 10 kg is shown in figure. Work...
Text Solution
|
- A wooden block of mass 0*8 kg is dragged along a level frictionless su...
Text Solution
|
- In the figure given below, the position–time graph of a particle of ma...
Text Solution
|