


Similar Questions
Explore conceptually related problems
Recommended Questions
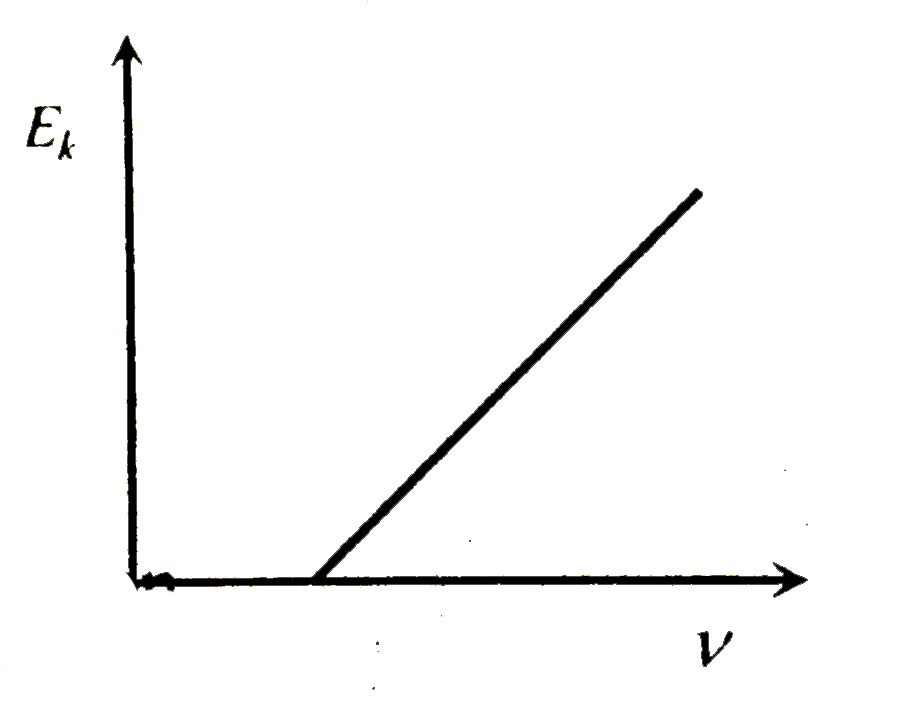
- For the photoelectric effect, the maximum kinetic energy E(k) of the e...
Text Solution
|
- The maximum kinetic energy of the emitted photoelectrons against frequ...
Text Solution
|
- For the photoelectric effect, the maximum kinetic energy E(k) of the e...
Text Solution
|
- The maximu kinetic energy (E(k)) of the photoelectron varies with freq...
Text Solution
|
- The photoelectric threshold frequency of a metal is v0. When ligth of ...
Text Solution
|
- प्रकाश-विद्युत प्रभाव के लिए उत्सर्जित फोटो इलेक्ट्रॉनों की अधिकतम गत...
Text Solution
|
- The photoelectric threshold frequency of a metal is v. When light of f...
Text Solution
|
- For the photoelectric effect, the maximum kinetic energy E(k) of the e...
Text Solution
|
- For photoelectric effect, the graph of the maximum kinetic energy K of...
Text Solution
|