


Similar Questions
Explore conceptually related problems
Recommended Questions
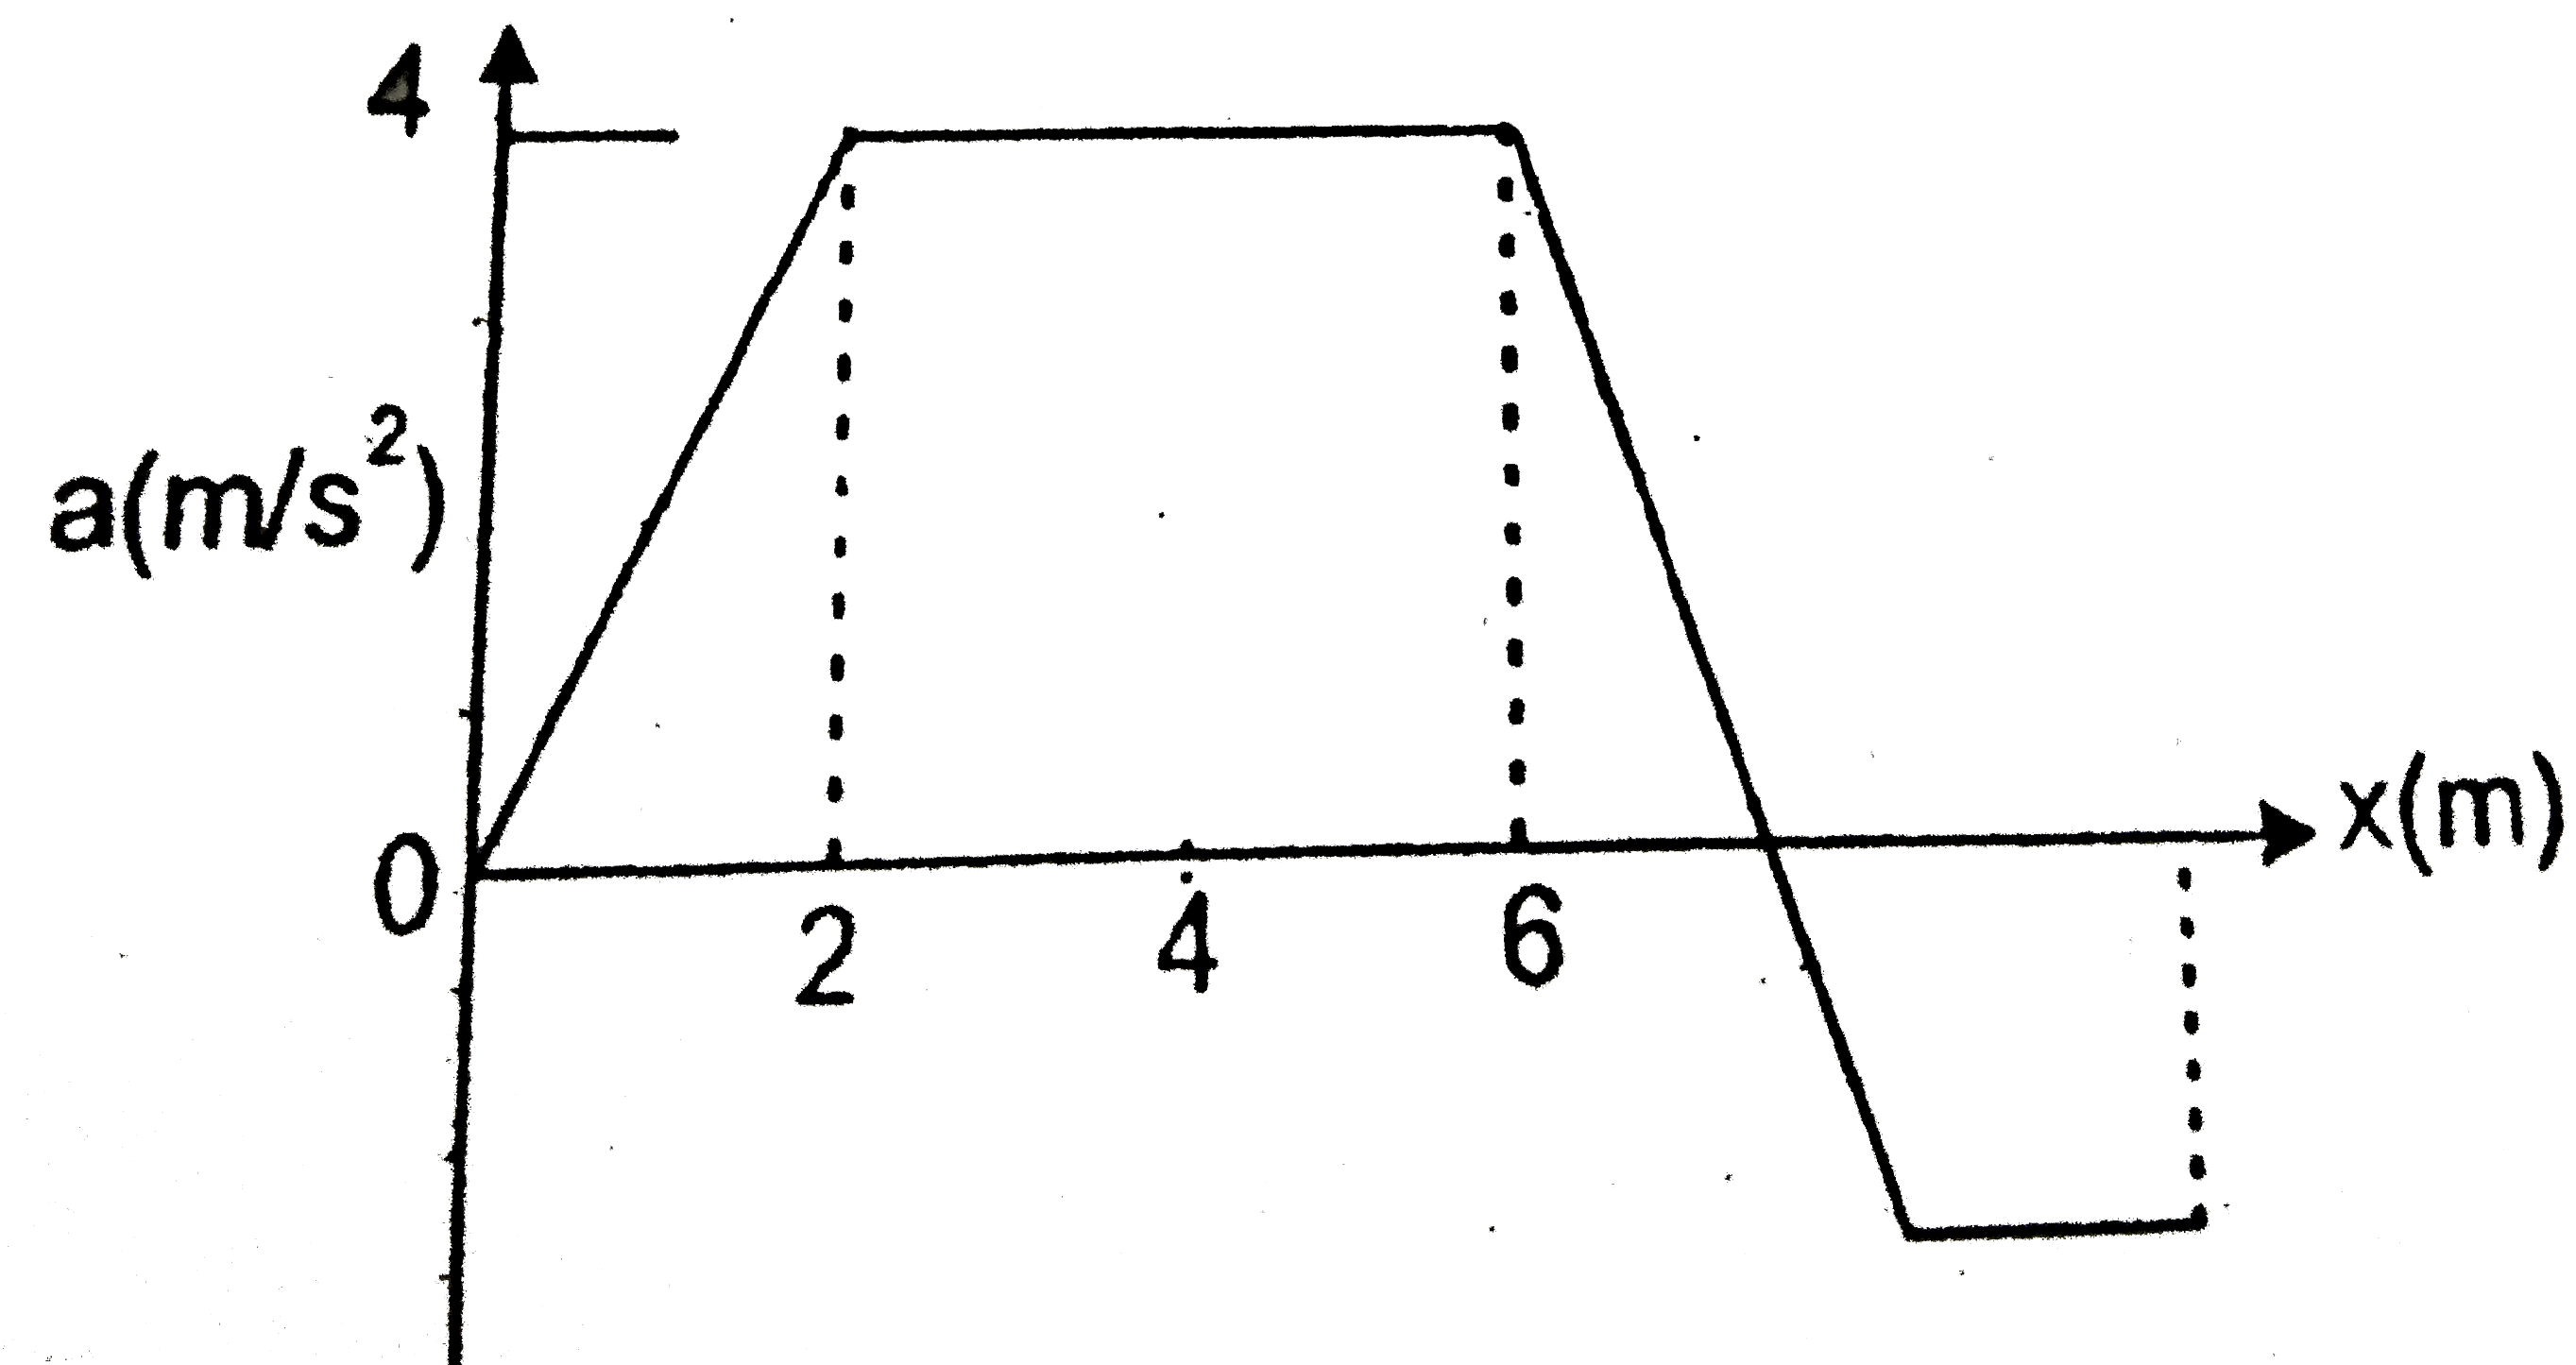
- Graph shows the acceleration of a 3kg particles as an applied force mo...
Text Solution
|
- A force F acting on a particle varies with the position x as shown in ...
Text Solution
|
- Graph shows the acceleration of a 3kg particles as an applied force mo...
Text Solution
|
- Graphs shows the acceleration of a 3 kg particle as an applied force m...
Text Solution
|
- The rate of doing work by force acting on a particle moving along x-ax...
Text Solution
|
- एक बल F=10+2xएक कण X-अक्ष के अनुदिश कार्यरत है जहाँ F न्यूटन में तथा ...
Text Solution
|
- चित्र में x-अक्ष पर चलते एक कण का विस्थापन समय के साथ बदलता हुआ दिखाया...
Text Solution
|
- The given figure shows a plot of the time dependent force F(x) acting ...
Text Solution
|
- If force F=(2x+3x^(2))N is applied on a particle along x = axis, then ...
Text Solution
|