


Similar Questions
Explore conceptually related problems
Recommended Questions
- Figure shows the variation in temperature (DT) with the amount of heat...
Text Solution
|
- Figure shows an isochore, an isotherm, an adiabatic and two isobars of...
Text Solution
|
- The ratio of the number of moles of a monoatomic to a polyatomic gas i...
Text Solution
|
- Figure shows the variation in temperature (DT) with the amount of heat...
Text Solution
|
- The amount of heat supplied to an ideal gas is laid off on the horizon...
Text Solution
|
- One mole of a monoatomic gas at 300K is mixed with two moles of diatom...
Text Solution
|
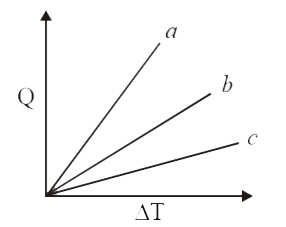
- The straight lines in the figure depict the variations in temperature ...
Text Solution
|
- If alpha moles of a monoatomic gas are mixed with beta moles of a poly...
Text Solution
|
- A triatomic, diatomic and monoatomis gas is supplied same amount of he...
Text Solution
|