


Similar Questions
Explore conceptually related problems
Recommended Questions
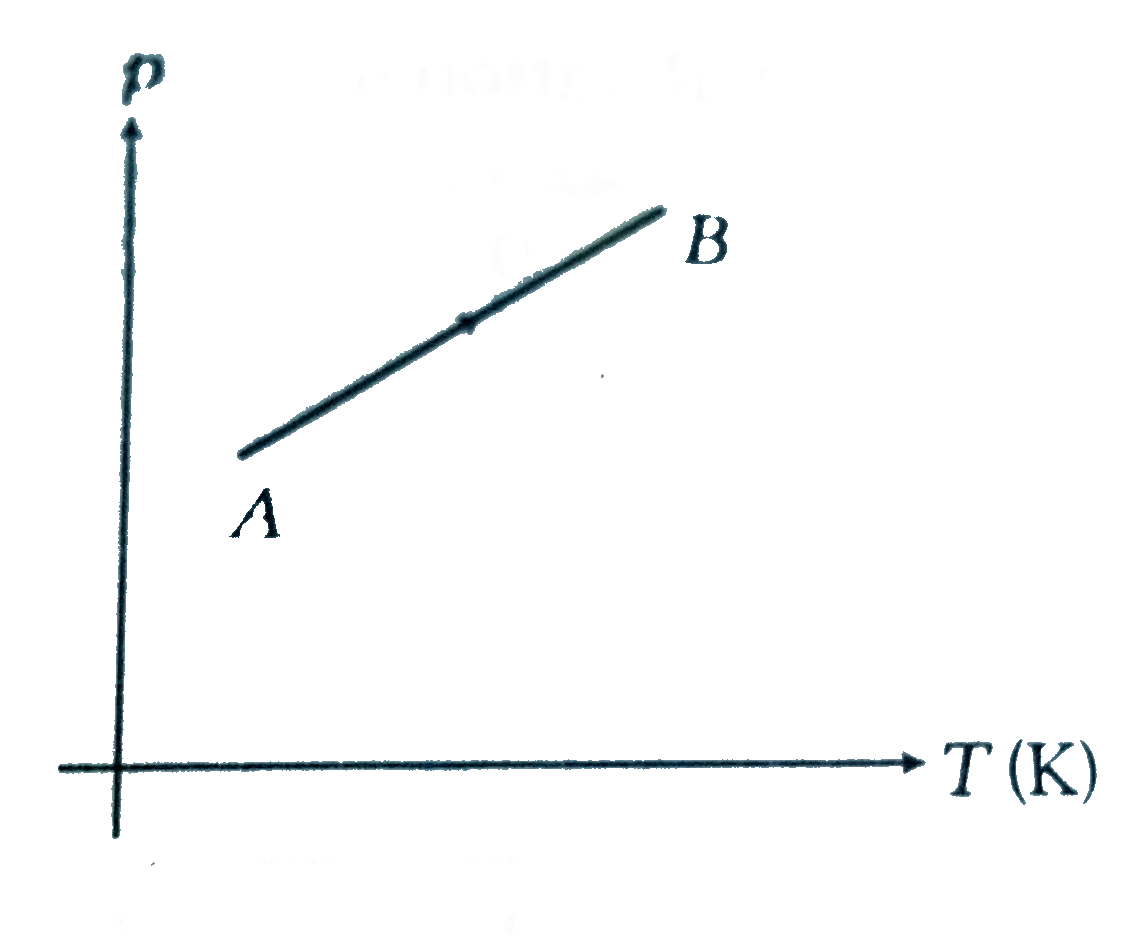
- The p-T graph for the given mass of an ideal gas is shown in figure. W...
Text Solution
|
- The three diagrams below depict three different processes for a given ...
Text Solution
|
- The slope of T-P graph for a given mass of a gas increases, the volumn...
Text Solution
|
- The P-T graph for the given mass of an ideal gas is shown in figure. T...
Text Solution
|
- V-T graph of a process of monoatomic ideal gas is shown in figure. Cha...
Text Solution
|
- The volume-temperature graphs of a given mass of an ideal gas at const...
Text Solution
|
- The p-T graph for the given mass of an ideal gas is shown in figure. W...
Text Solution
|
- P-T graphs of an ideal gas are as shown in figures-2.42 below. Choose ...
Text Solution
|
- The volume-temperature graphs of a given mass of an ideal gas at const...
Text Solution
|