


Similar Questions
Explore conceptually related problems
Recommended Questions
- Graph showing the variation of current versus voltage for a material G...
Text Solution
|
- The current-voltage graph of a device is shown in figure. The resistan...
Text Solution
|
- Graph showing the variation of current versus voltage for a material G...
Text Solution
|
- Plot a graph showing variation of current versus voltage for the mater...
Text Solution
|
- (a) Draw graph showing the variation of current versus voltage in an e...
Text Solution
|
- ओम के नियम के अनुसार विभवान्तर व धारा के बीच ग्राफ होगा एक -
Text Solution
|
- ओम के नियम के अनुसार विभवान्तर व धारा के बीच ग्राफ होगा एक
Text Solution
|
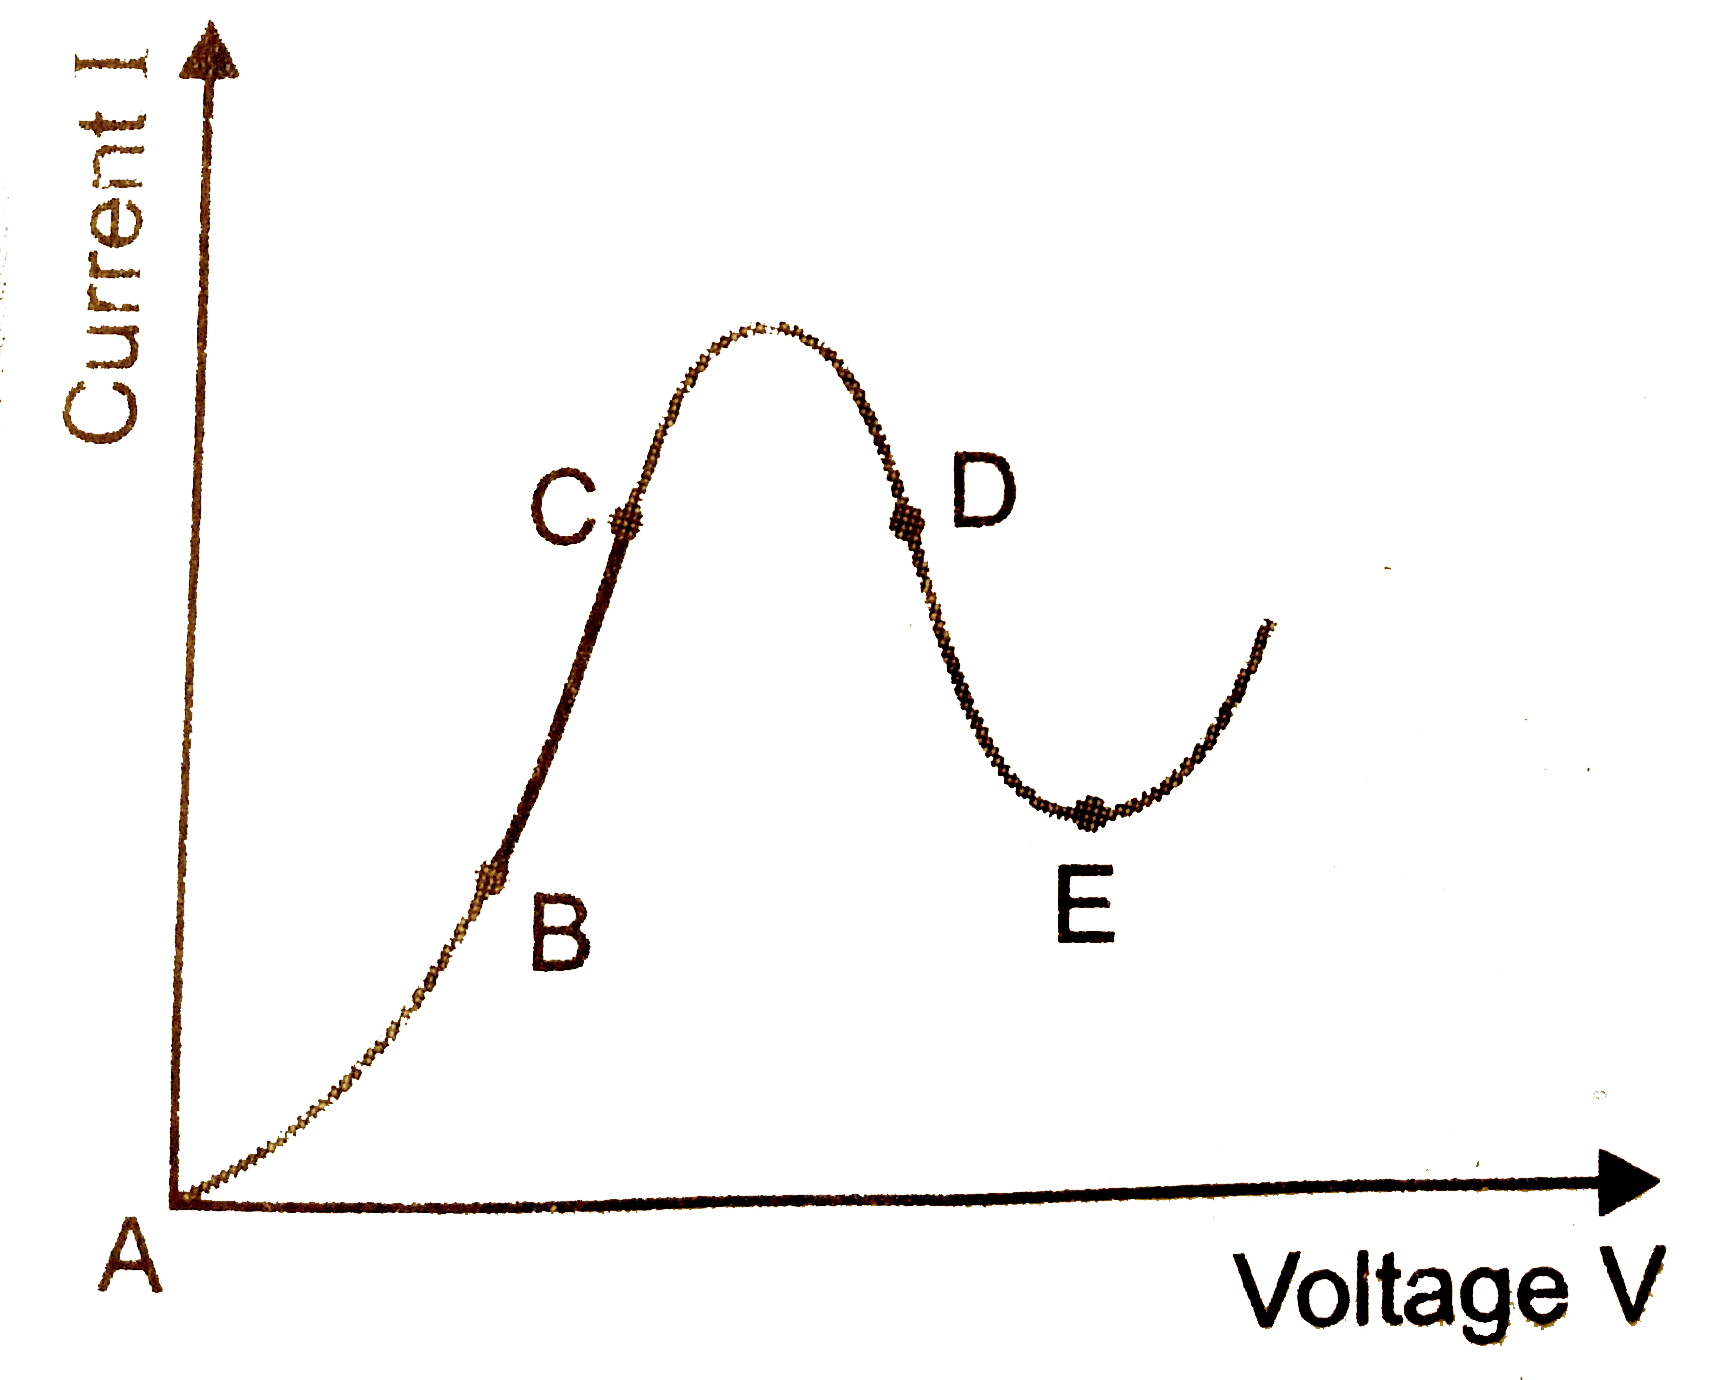
- Show the variation of current versus voltage graph for GaAs and mark t...
Text Solution
|
- Plot a graph showing variation of current versus voltage for the mater...
Text Solution
|