


Similar Questions
Explore conceptually related problems
Recommended Questions
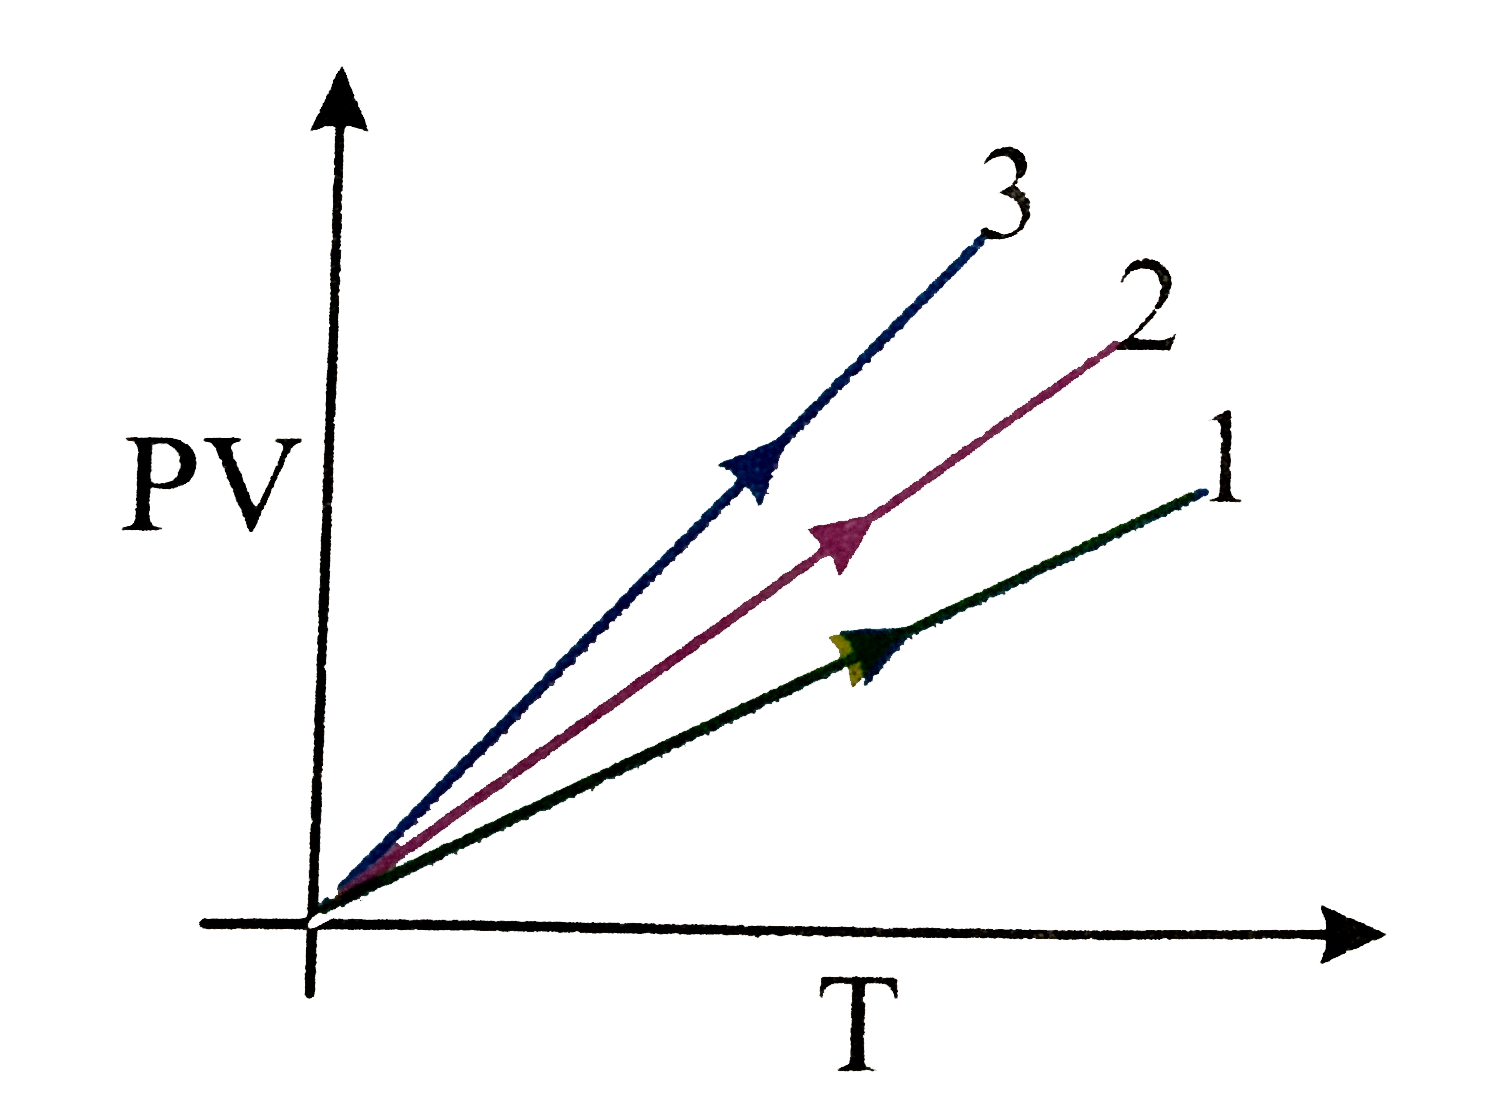
- PV versus T graph of equal masses of H(2), He and CO(2) is shown in fi...
Text Solution
|
- Force acting on a block versus time graph is as shown in figure Choose...
Text Solution
|
- Pressure versus temperature graph of an ideal gas of equal number of m...
Text Solution
|
- A graph of x versus t is shown in figure. Choose correct alternative f...
Text Solution
|
- PV versus T graph of equal masses of H(2) , He and CO(2) is shown in f...
Text Solution
|
- A particle is moving in such a way that its velocity versus time graph...
Text Solution
|
- Pressure versus temperature graph of an ideal gas of equal number of m...
Text Solution
|
- PV versus T graph of equal masses of H(2) , He and O(2) is shown in Fi...
Text Solution
|
- The graph in figure shows the velocity v versus time t for a body. Whi...
Text Solution
|