 .
.


Similar Questions
Explore conceptually related problems
Recommended Questions
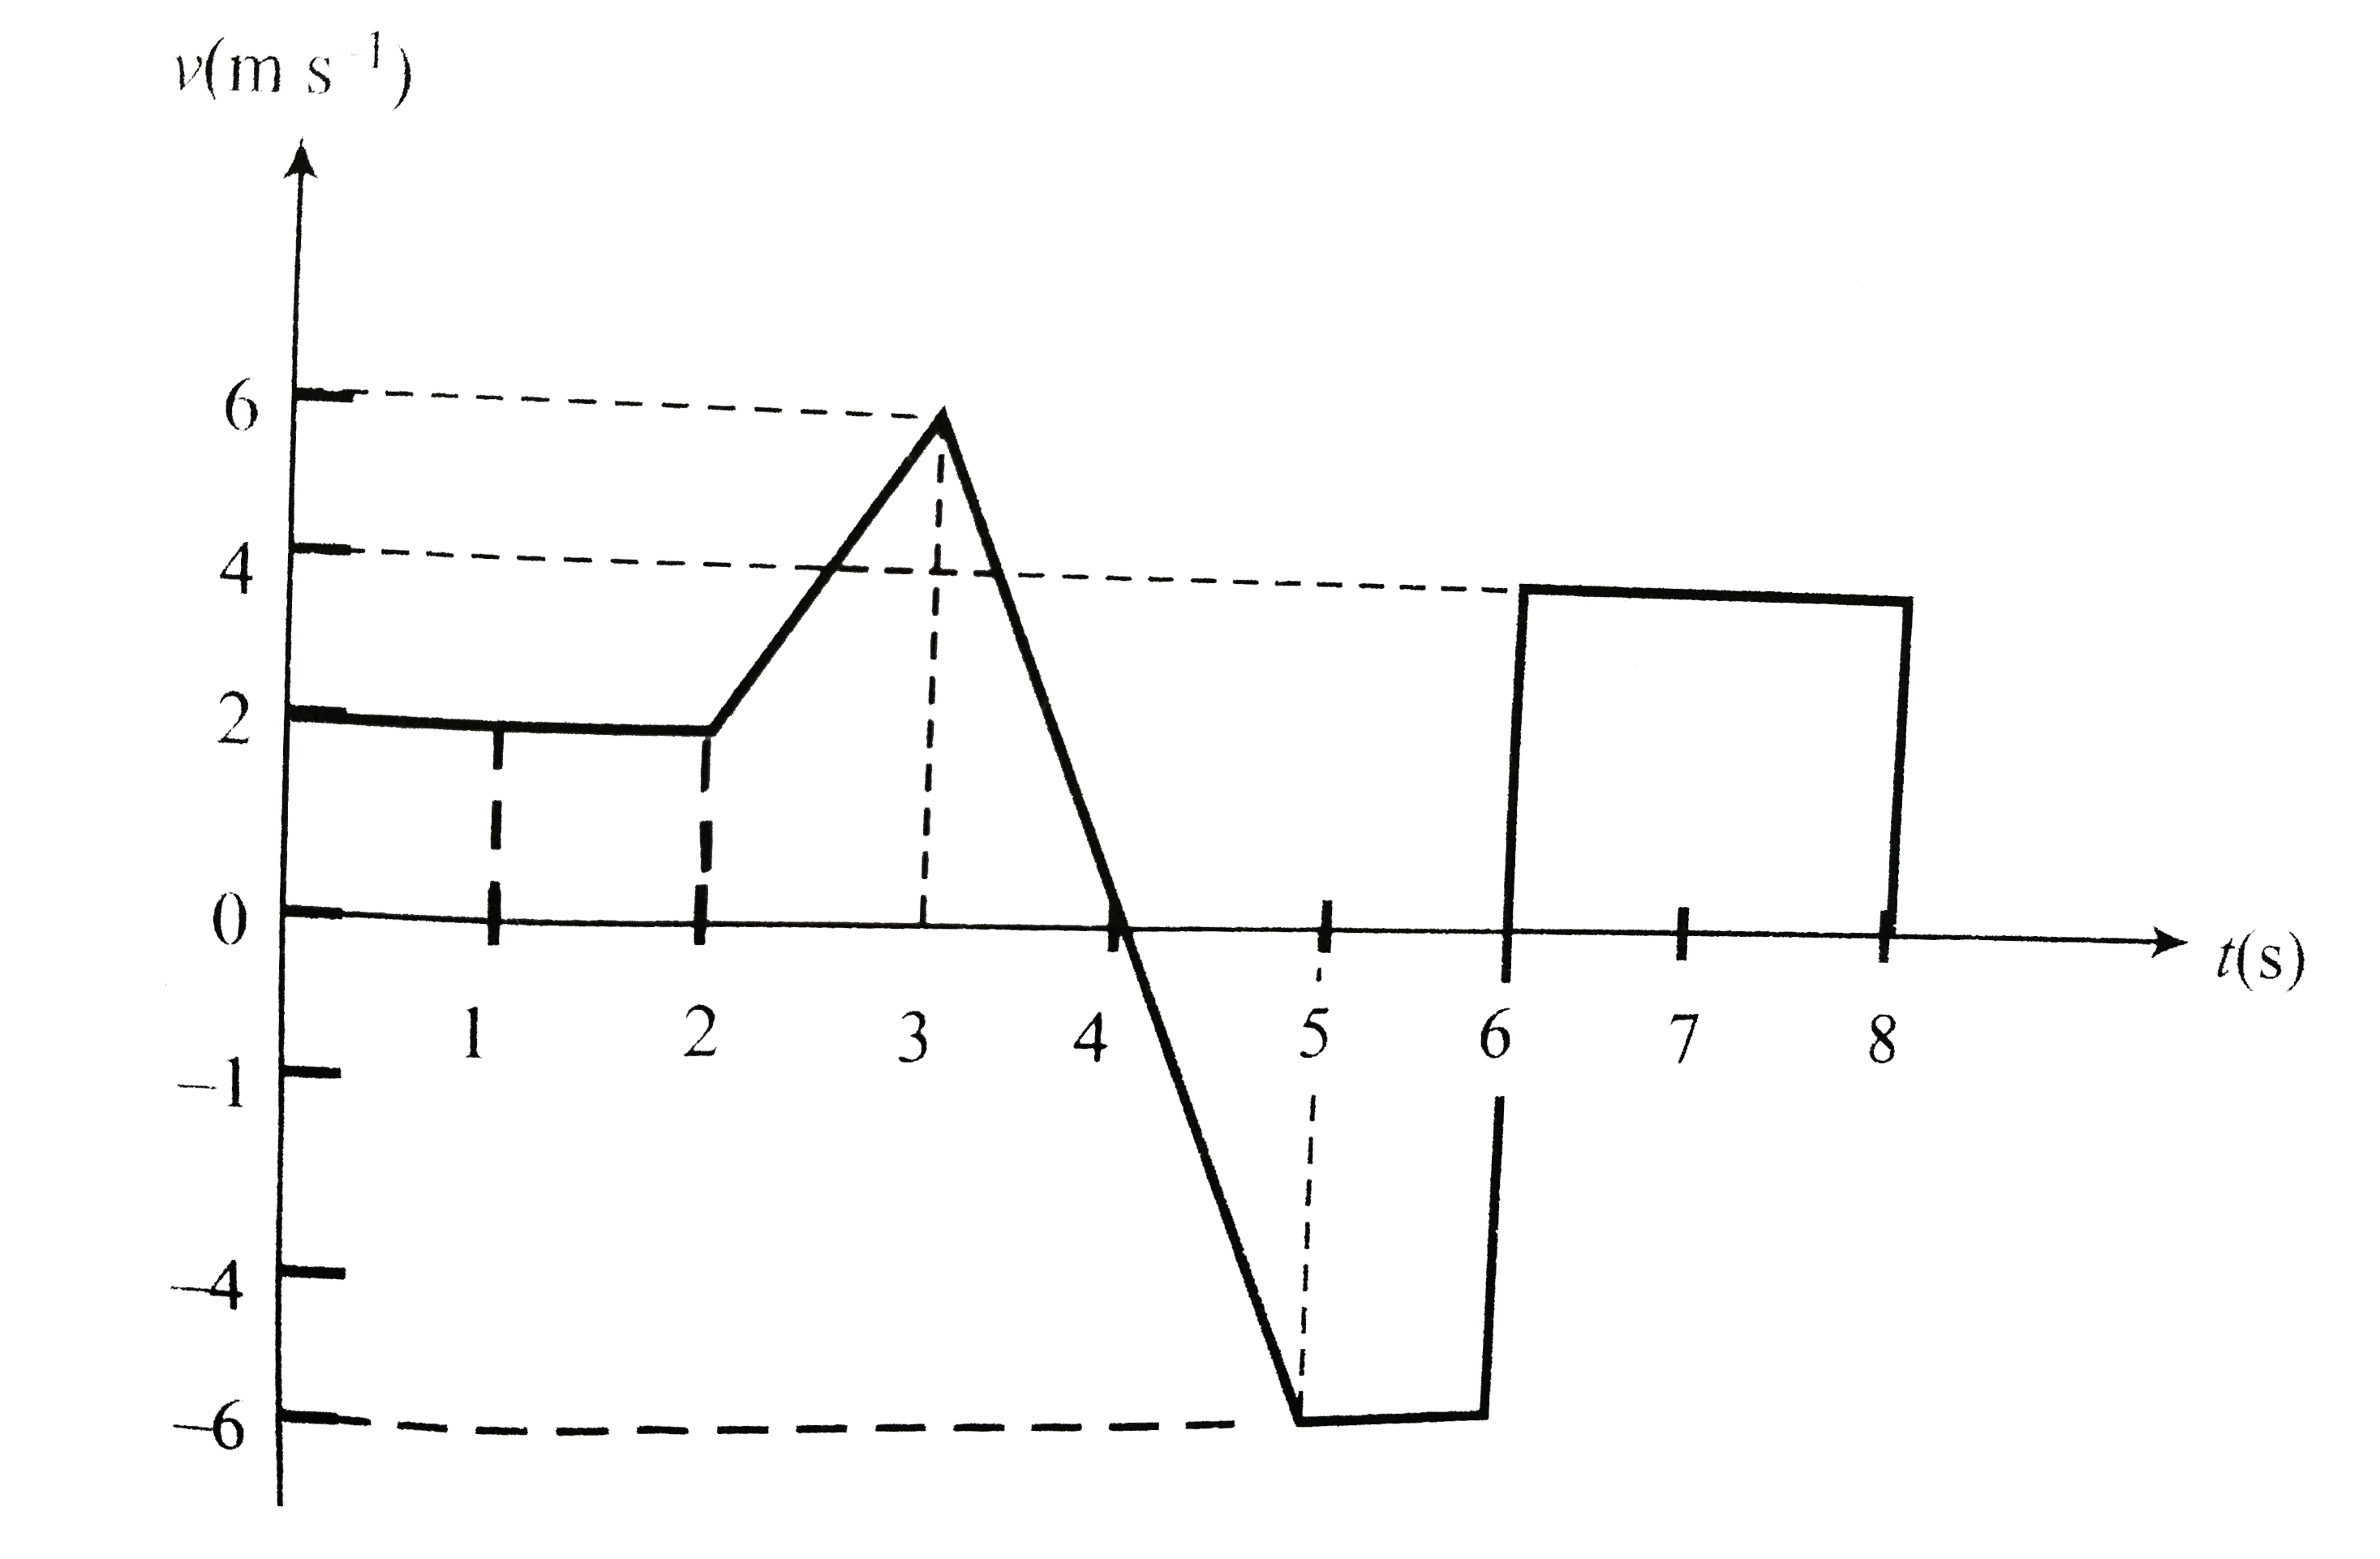
- The velocity-time graph of a body is shown in . The displacement of ...
Text Solution
|
- The velocity-time graph of a body is shown in . The displacement of ...
Text Solution
|
- The displacement-time graph of a body is shown in. . The velocity-...
Text Solution
|
- Assertion: The slope of displacement-time graph of a body moving with ...
Text Solution
|
- Velocity-time graph for a body moving with retardation is shown. Calcu...
Text Solution
|
- सरल रेखा में गतिमान एक पिंड का वेग-समय ग्राफ निम्न चित्र में दर्शाया ग...
Text Solution
|
- The velocity versus time graph of a body in a straight line is as show...
Text Solution
|
- The velocity-time graph of a body moving in one dimension is as shown ...
Text Solution
|
- The displacement time graph of a body in motion is given as shown in t...
Text Solution
|