Home
Class 12
CHEMISTRY
Graph of incident freuency with stopping...

Graph of incident freuency with stopping potential in photoelectric effect is

A

B

C

D

Text Solution

AI Generated Solution

The correct Answer is:
To understand the relationship between incident frequency and stopping potential in the photoelectric effect, we can break down the solution into the following steps: ### Step 1: Understand the Photoelectric Effect The photoelectric effect occurs when light (photons) hits a metal surface and causes the ejection of electrons. The energy of the incident photons is related to their frequency. ### Step 2: Define Key Terms - **Incident Frequency (ν)**: The frequency of the incoming light. - **Stopping Potential (V₀)**: The potential required to stop the emitted electrons from reaching the anode in a photoelectric experiment. - **Threshold Frequency (ν₀)**: The minimum frequency required to eject electrons from the metal surface. ### Step 3: Relationship Between Frequency and Stopping Potential According to Einstein's photoelectric equation: \[ E = hν = eV₀ \] Where: - \( E \) is the energy of the photon, - \( h \) is Planck's constant, - \( e \) is the charge of the electron, - \( V₀ \) is the stopping potential. From this equation, we can derive: \[ V₀ = \frac{hν}{e} \] This shows that the stopping potential is directly proportional to the frequency of the incident light. ### Step 4: Graphing the Relationship 1. **X-axis**: Incident Frequency (ν) 2. **Y-axis**: Stopping Potential (V₀) - At the threshold frequency (ν₀), the stopping potential (V₀) is zero because the energy of the photons is just enough to eject the electrons. - As the frequency increases beyond the threshold frequency, the stopping potential increases linearly. ### Step 5: Conclusion The graph of incident frequency (ν) versus stopping potential (V₀) will be a straight line starting from the point (ν₀, 0) and rising linearly as frequency increases. This indicates that as the frequency increases, the stopping potential also increases. ### Final Graph Representation The graph will look like this: - A straight line starting from the point (ν₀, 0) and moving upwards to the right.
Promotional Banner

Topper's Solved these Questions

  • STRUCTURE OF ATOM

    AAKASH INSTITUTE|Exercise ASSIGNMENT ( SECTION -C) Objective Type Questions (More than one options are correct)|15 Videos
  • STRUCTURE OF ATOM

    AAKASH INSTITUTE|Exercise ASSIGNMENT ( SECTION -D) Linked Comprehension Type Questions)|9 Videos
  • STRUCTURE OF ATOM

    AAKASH INSTITUTE|Exercise ASSIGNMENT ( SECTION -A) Objective Type Questions (One option is correct)|47 Videos
  • STRUCTURE OF ATOM

    AAKASH INSTITUTE|Exercise ASSIGNMENT (SECTION -D) Assertion-Reason Type Questions|15 Videos
  • SURFACE CHEMISTRY

    AAKASH INSTITUTE|Exercise Assignment Section - C (Assertion - Reason type questions)|10 Videos

Similar Questions

Explore conceptually related problems

The magnitude of stopping potential for the photoelectric effect is

What is the effect of decrease in frequency of incident radiation on the stopping potential in photoelectric emission?

What, if any, is the effect of the (i) intensity (ii) frequency of incident radiation on the stopping potential in photoelectric emission?

The stopping potential of a given photoelectric device is depended on

Define the term 'stopping potential' in relation to photoelectric effect.

The graph between stopping potential and intensity of light in photoelectric effect is

The slope of the stopping potential versus frequency graph for photoelectric effect is equal to:

When monochromatic light of wavelength lambda is incident on a metallic surface the stopping potential for photoelectric current is 3V_(0) when same surface is illuminated with light of waelength 2lambda the stopping potential is V_(0) The threshold wavelength for this surface when photoelectric effect takes place is

AAKASH INSTITUTE-STRUCTURE OF ATOM -ASSIGNMENT ( SECTION -B) Objective Type Questions (One option is correct)
  1. With increasing principal quantum number , the energy difference betwe...

    Text Solution

    |

  2. H(α) line of Balmer series is 6500 Å . The wave length of H(gamma) is

    Text Solution

    |

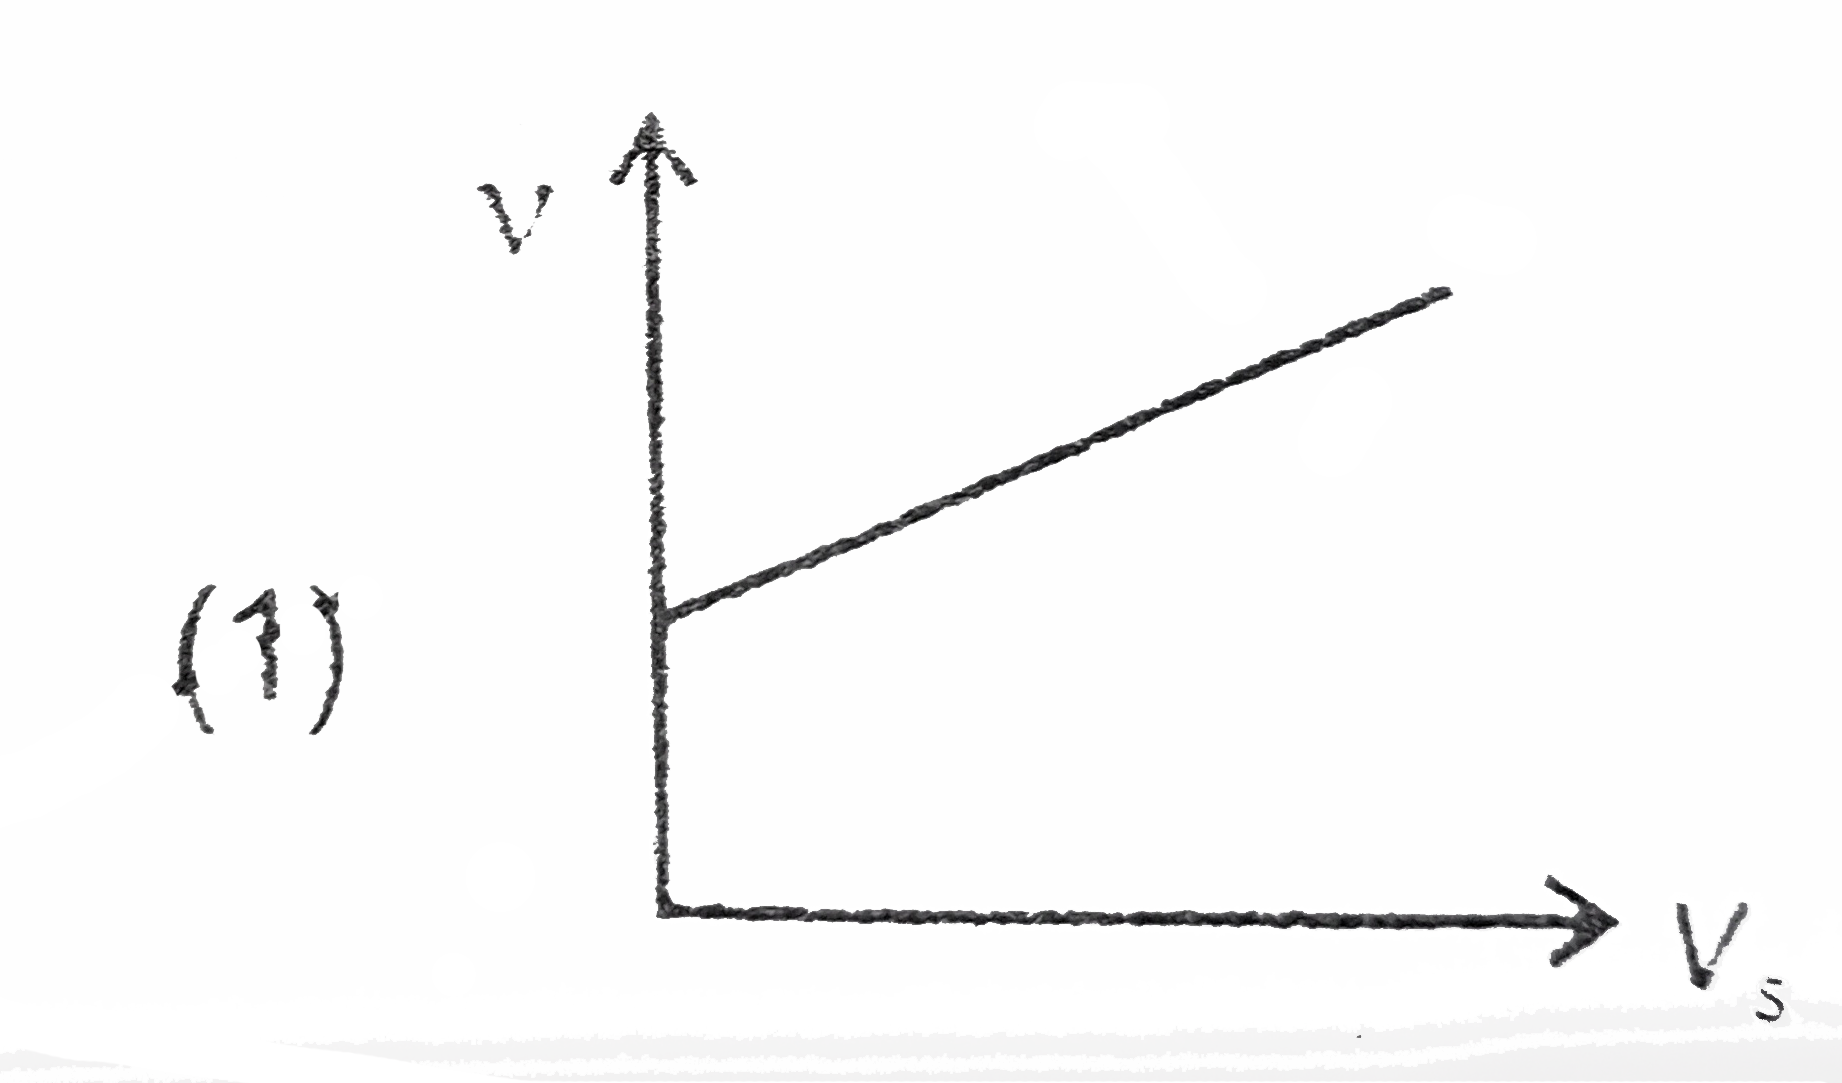
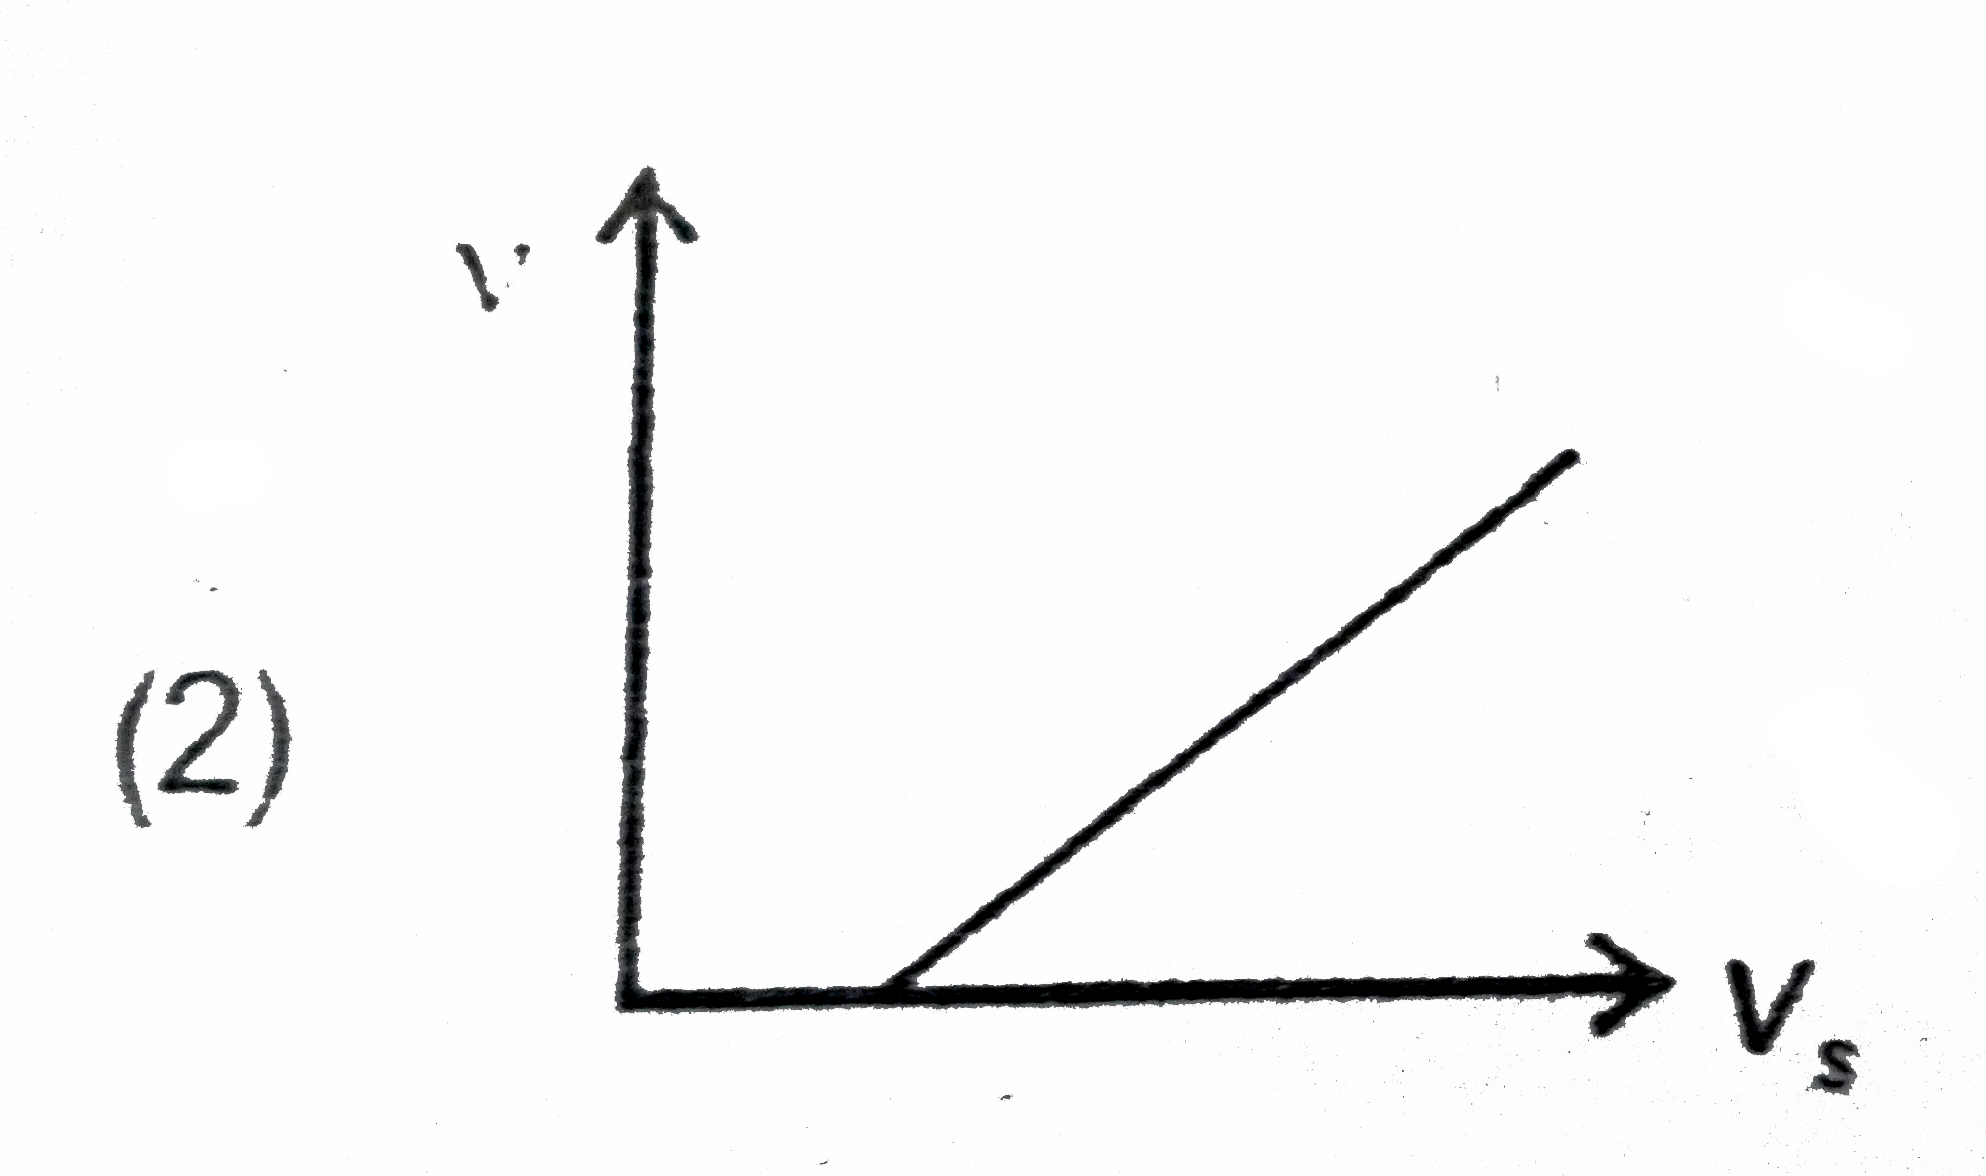
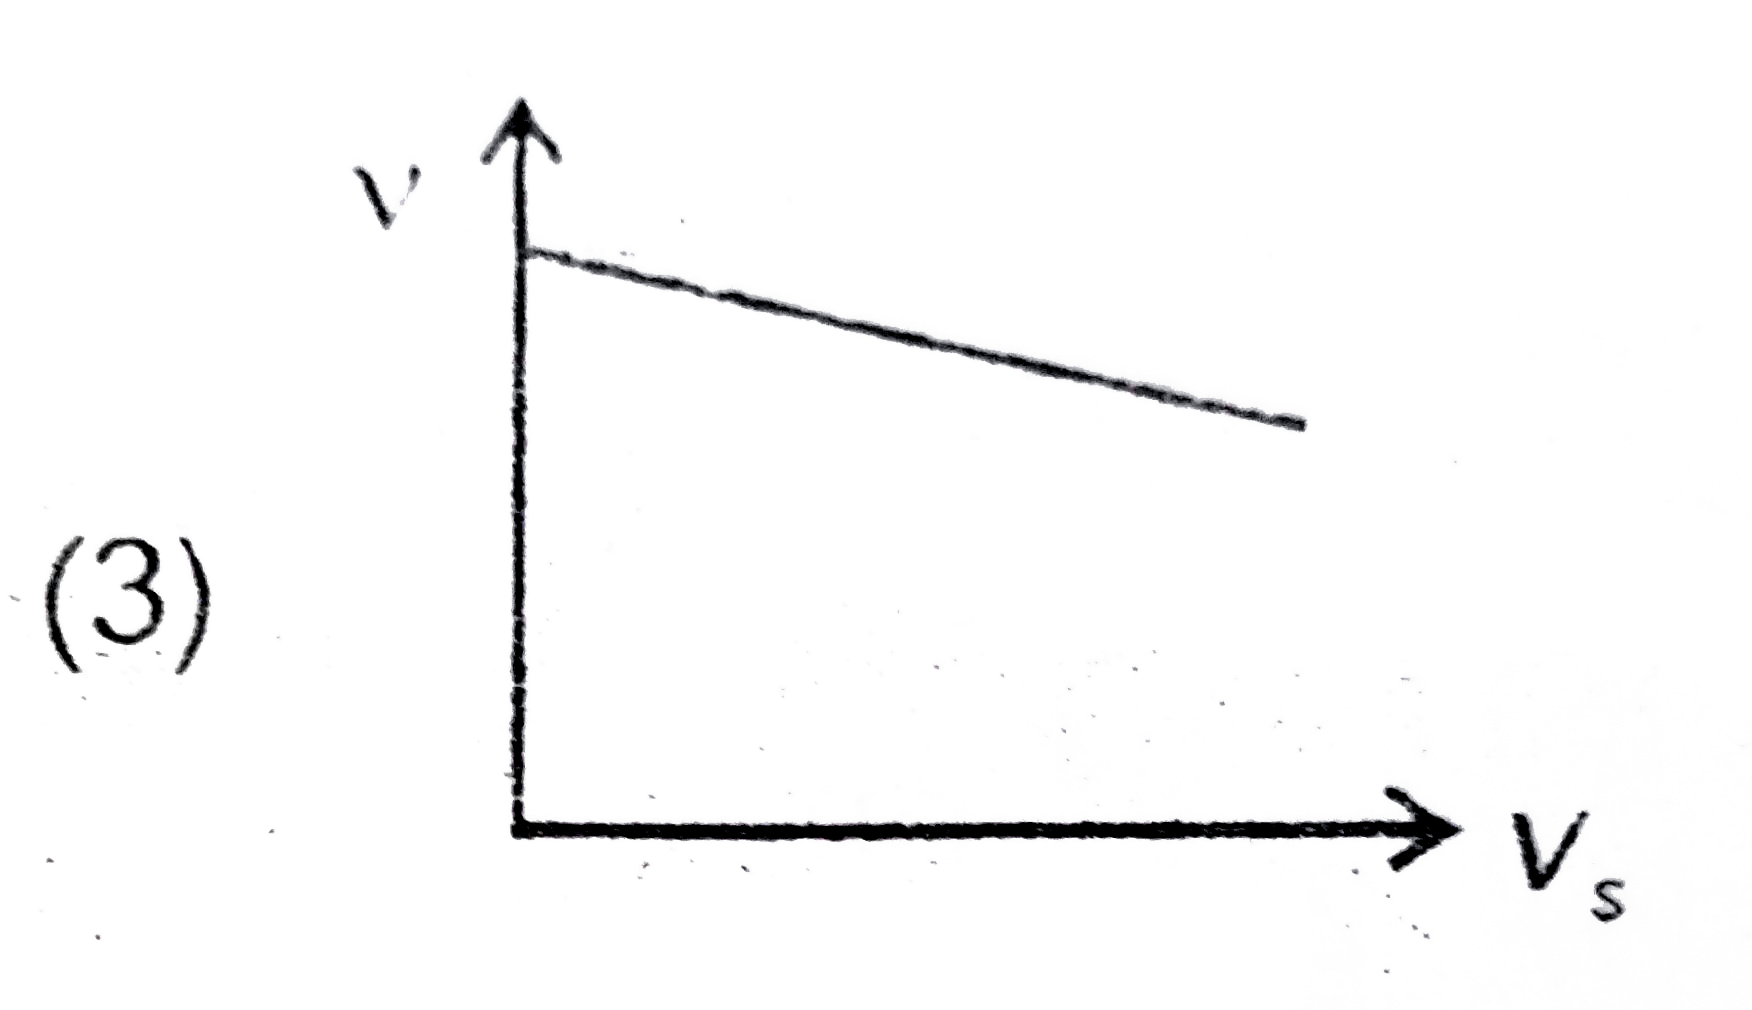
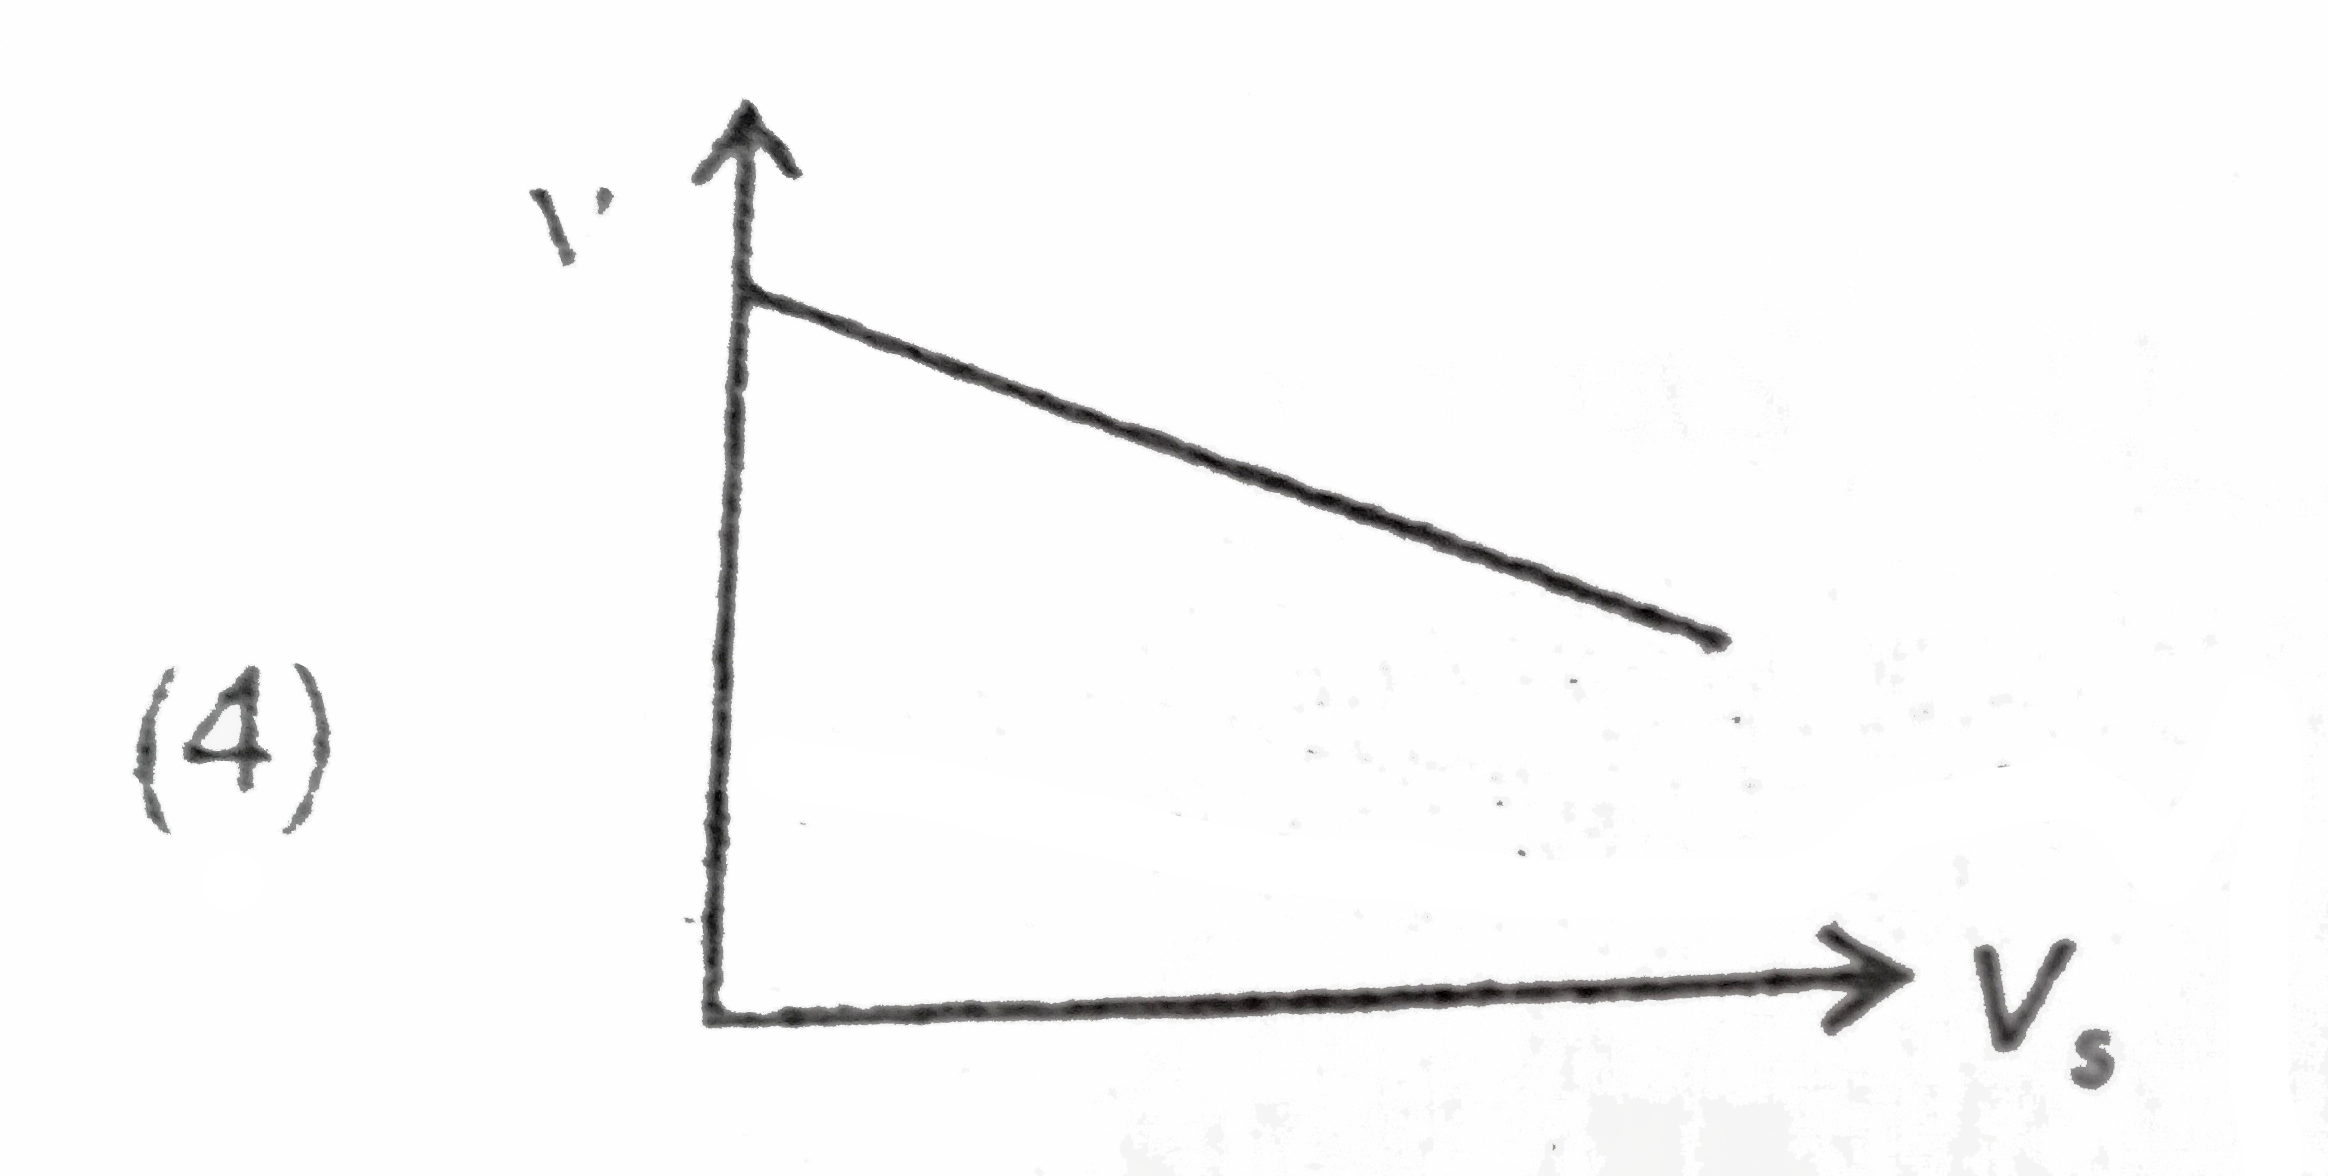
  3. Graph of incident freuency with stopping potential in photoelectric ef...

    Text Solution

    |

  4. The orbital diagram in which Hund's rule and Aufbau principle is viola...

    Text Solution

    |

  5. The total spin resulting from d^(9) configuration is

    Text Solution

    |

  6. How many nodal planes are present in 4d(z^(2)) ?

    Text Solution

    |

  7. An electron is moving in 3^(rd) orbit of Li^(+2) and its separation e...

    Text Solution

    |

  8. If radius of 2^(nd) orbit is x then di-Broglie wavelength in4^(th)orbi...

    Text Solution

    |

  9. Calculate the wavelength of light required to break the bond between t...

    Text Solution

    |

  10. An electron is moving in 3rd orbit of Hydrogen atom . The frequency of...

    Text Solution

    |

  11. The wavelength of a spectral life for an electronic transition inverse...

    Text Solution

    |

  12. In the Rutherford scattering experiment the number of alphaparticles s...

    Text Solution

    |

  13. The number of quanta of radiation of frequncy 4.98 xx 10^(14) s^(-1) r...

    Text Solution

    |

  14. Photoelectric emmision is observed from a surface when lights of freq...

    Text Solution

    |

  15. The velocity of electron moving in 3rd orbit of He^(+) is v. The veloc...

    Text Solution

    |

  16. Which electronic configuration is not allowed for a neutral atom or an...

    Text Solution

    |

  17. If E(1) , E(2) "and" E(3) represent respectively the kinetic energies ...

    Text Solution

    |

  18. Choose the correct statement

    Text Solution

    |

  19. Consider psi (wave function) of 2s atomic orbital of H-atom is- psi...

    Text Solution

    |

  20. In which of the following, maximum wavelength is emitted ?

    Text Solution

    |