Home
Class 12
PHYSICS
The position-time graph for two particle...

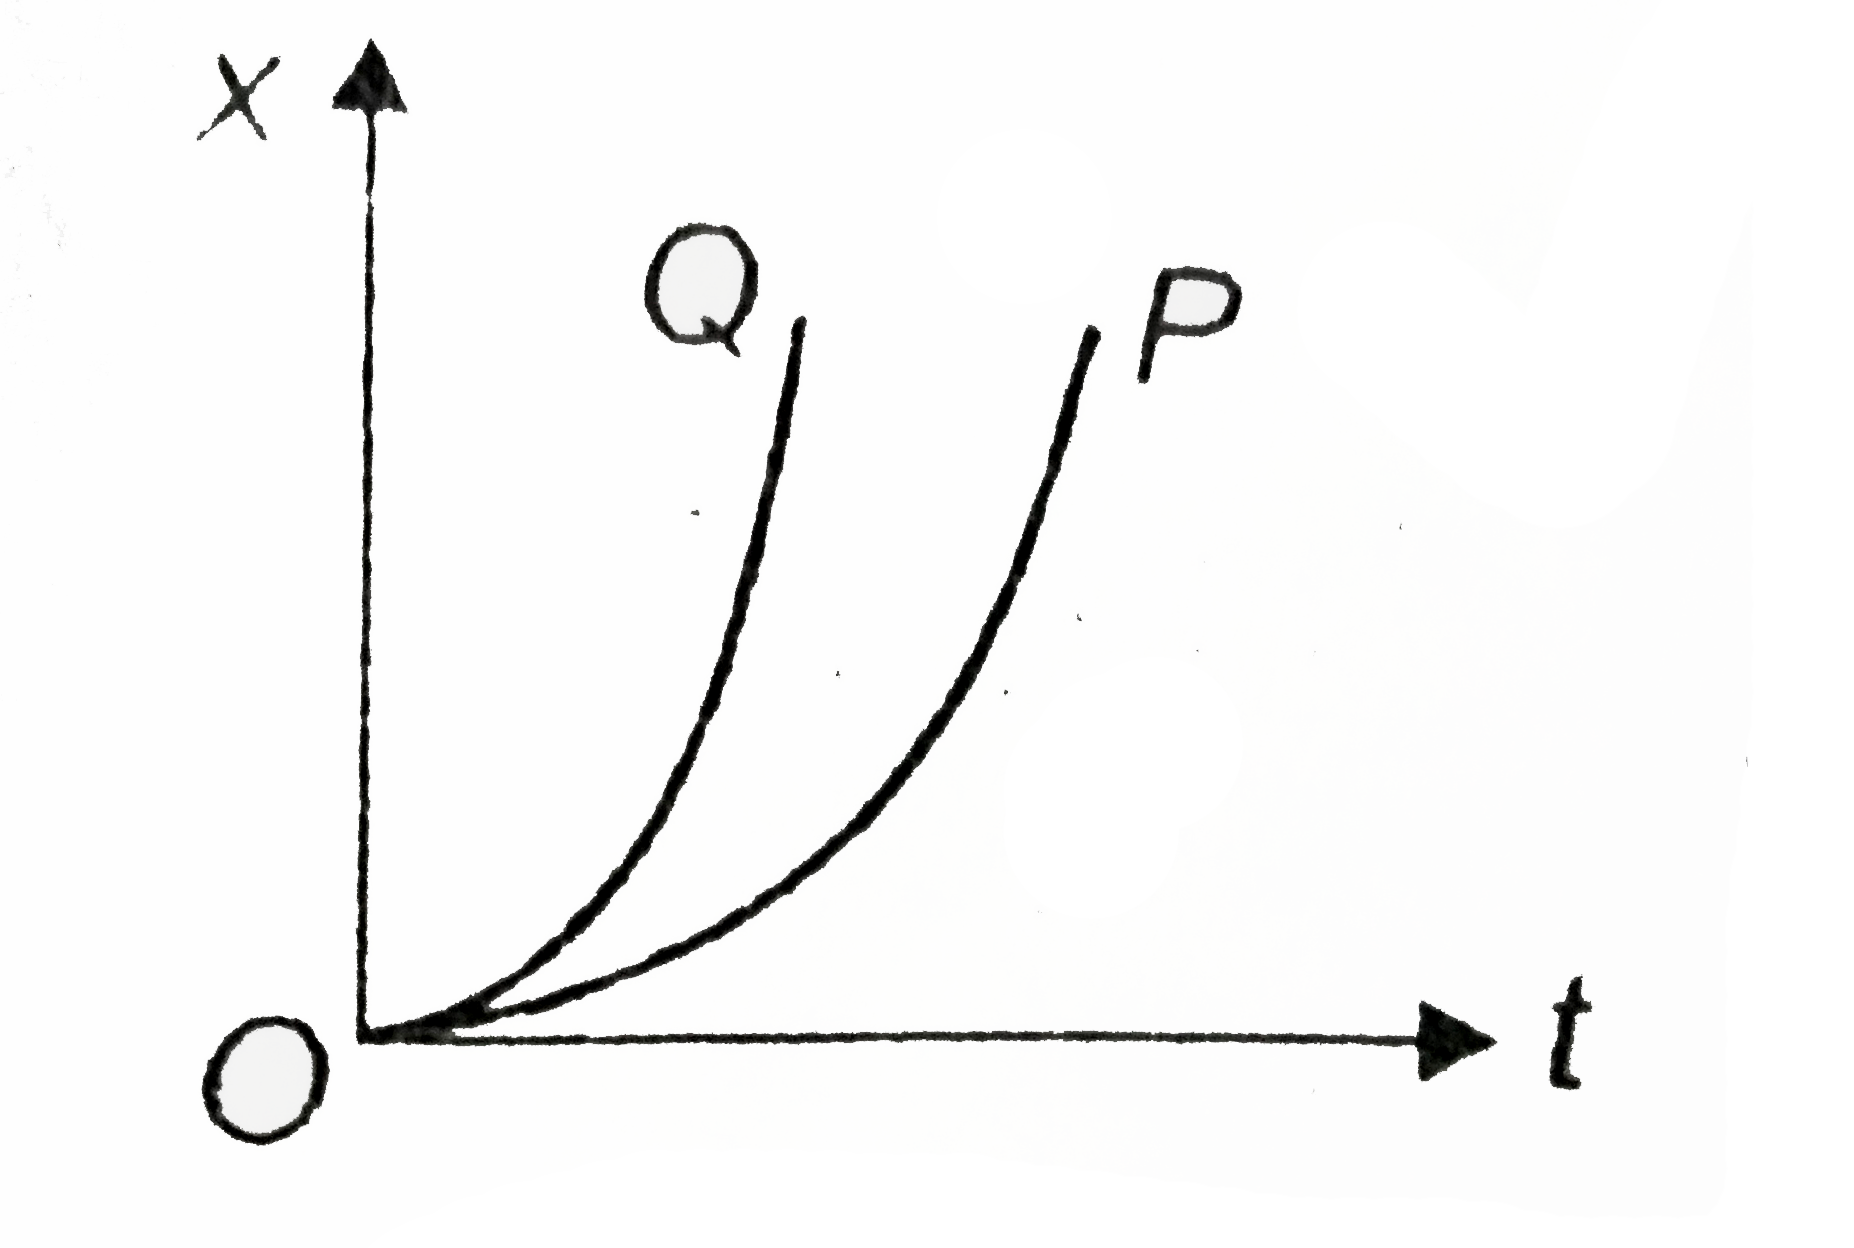
The position-time graph for two particles P and Q moving on x-axis is shown in the figure. Then

A

The separation between P and Q remains constant with time

B

The acceleration of Q is greater than that of P

C

The relative velocity of Q w.r.t. P is increasing with time

D

The relative velocity of Q w.r.t. P is decreasing with time

Text Solution

Verified by Experts

The correct Answer is:
B, C
Doubtnut Promotions Banner Mobile Dark
|

Topper's Solved these Questions

  • MOTION IN STRAIGHT LINE

    AAKASH INSTITUTE|Exercise Assignment (SECTION - D)|24 Videos
  • MOTION IN STRAIGHT LINE

    AAKASH INSTITUTE|Exercise Assignment (SECTION - E)|8 Videos
  • MOTION IN STRAIGHT LINE

    AAKASH INSTITUTE|Exercise Assignment (SECTION - B)|19 Videos
  • MOTION IN A STRAIGHT LINE

    AAKASH INSTITUTE|Exercise ASSIGNMENT (SECTION - D)|15 Videos
  • MOVING CHARGE AND MAGNESIUM

    AAKASH INSTITUTE|Exercise SECTION D|16 Videos

Similar Questions

Explore conceptually related problems

The velocity time graph for a particle moving along x-axis is shown in the figure. The corresponding displacement time graph is correctly shown by

The position (X)-time (t) graph for a particle of mass 1 kg moving along x-axis is shown in figure. Find impulse on particle at t = 4 s.

Knowledge Check

  • The velocity-time graph for a particle moving along X-axis is shown in the figure. The corresponding displacement-time graph is correctly shown by

    A
    B
    C
    D
  • The velocity time graph for a particle moving along X-axis is shown in the figure. The corresponding displacement time graph is correctly shown by

    A
    B
    C
    D
  • The velocity (v) - time (t) graph for a particle moving along x - axis is shown in the figure. The corresponding position (x) - time (t) is best represented by

    A
    B
    C
    D
  • Similar Questions

    Explore conceptually related problems

    The acceleration-time graph of a particle moving along x-axis is shown in the figure. If the particle starts with velocity 3 m/s at t = 0, find the velocity of particle at t = 4 s.

    The position time graph for a particle moving along X axis has been shown in the fig. At which of the indicated points the particle has (i) negative velocity but acceleration in positive X direction. (ii) positive velocity but acceleration in negative X direction. (iii) received a sharp blow (a large force for negligible interval of time)?

    The position - time graph for a particle moving along a straight line is shown in figure. The total distance travelled by it in time t = 0 to t = 10 s is

    The acceleration - time graph for a particle moving along x - axis is shown in figure, If the initial velocity of particle is -5m//s , the velocity at t = 8 s is

    Position-time graph for a particle moving along x- direction is as shown in the figure. Average speed of the particle from t = 0 to t = 4 is :