


Similar Questions
Explore conceptually related problems
Recommended Questions
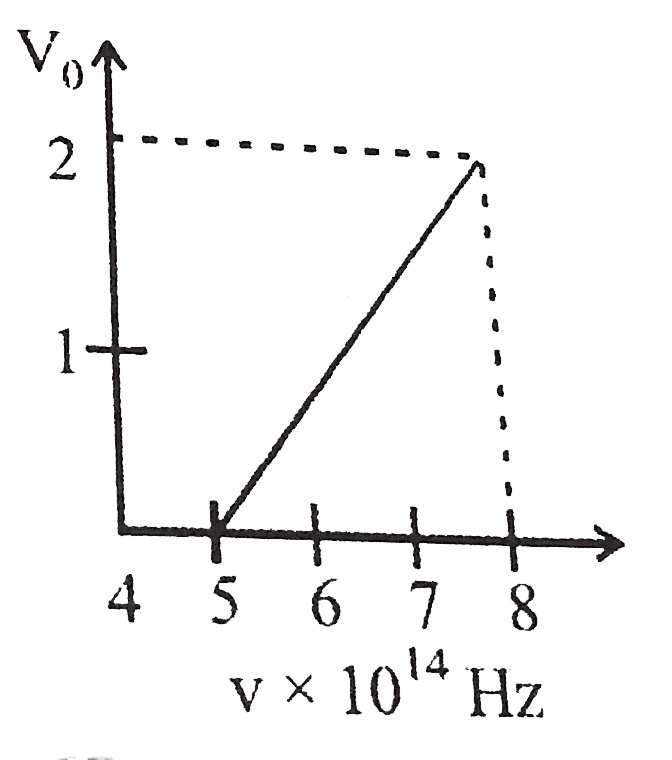
- The stopping potential (V(0)) versus frequency (v) plot of a substance...
Text Solution
|
- Figure shows the plot of the stopping potential versus the frequency o...
Text Solution
|
- The graph shows variation of stopping potential V(0) versus frequency ...
Text Solution
|
- The graph between the stopping potential V(0) and frequency v for two ...
Text Solution
|
- The stopping potential (V(0)) versus frequency (v) plot of a substance...
Text Solution
|
- Slope of V(0)-v curve is- (where V(0)= Stopping potential and v=freq...
Text Solution
|
- When monochromatic light of wavelength lambda illuminates a metal surf...
Text Solution
|
- When a certain photosensistive surface is illuminated with monochromat...
Text Solution
|
- When a certain metal surface is illuminated wth light of frequency v, ...
Text Solution
|