


Similar Questions
Explore conceptually related problems
Recommended Questions
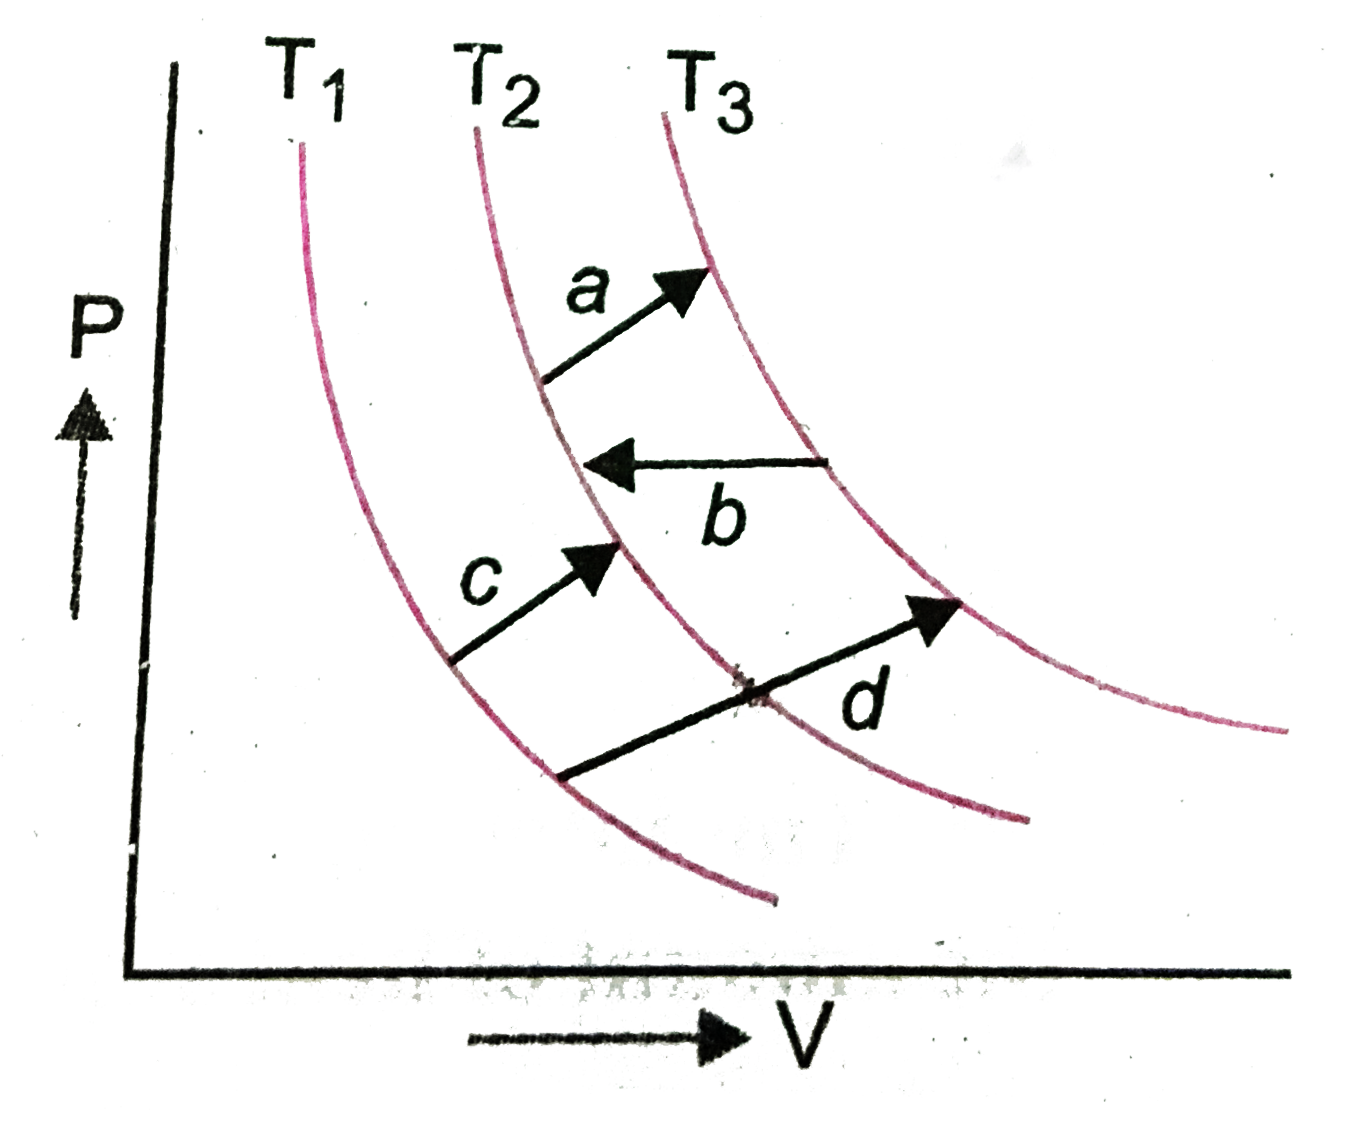
- (Figure) Shows three isothermal curves at temp T(1), T(2) and T(3) T...
Text Solution
|
- If the normals at points t1a n dt2 meet on the parabola, then t1t2=1 ...
Text Solution
|
- Shown below are the black body radiation curves at temperature T(1) an...
Text Solution
|
- (Figure) Shows three isothermal curves at temp T(1), T(2) and T(3) T...
Text Solution
|
- Isothermal curves for a given mass of gas are shown at two different t...
Text Solution
|
- Consider three blocks of masses m(1),m(2),m(3) interconnected by strin...
Text Solution
|
- the intial state A has the temperature T(A)U(A) as the internal energy...
Text Solution
|
- यदि एक वृत्त किसी समकोणीय अतिपरवलय से चार बिन्दुओं t(1),t(2),t(3) तथा ...
Text Solution
|
- Path of three projectiles are shown. If T(1),T(2) and T(3) are time o...
Text Solution
|