


Recommended Questions
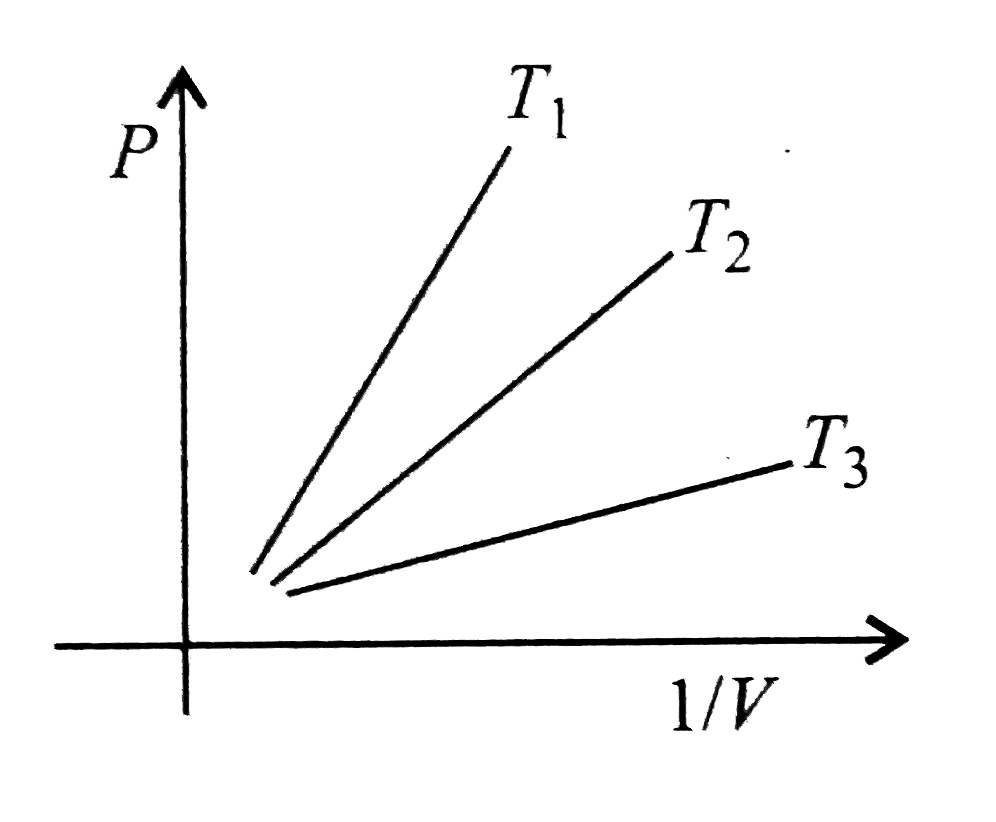
- The curve drawn below shows the variations of P as a function of 1//V ...
Text Solution
|
- The curve drawn below shows the variations of P as a function of 1//V ...
Text Solution
|
- The given curve represents the variation of temperature as a function ...
Text Solution
|
- When a sample of ideal gas is changed from an initial state to a final...
Text Solution
|
- When a sample of ideal gas is changed from an initial state to a final...
Text Solution
|
- When a sample of ideal gas is changed from an initial state to a final...
Text Solution
|
- When a sample of ideal gas is changed from an initial state to a final...
Text Solution
|
- When a sample of ideal gas is changed from an initial state to a final...
Text Solution
|
- When a sample of ideal gas is changed from an initial state to a final...
Text Solution
|