


Similar Questions
Explore conceptually related problems
Recommended Questions
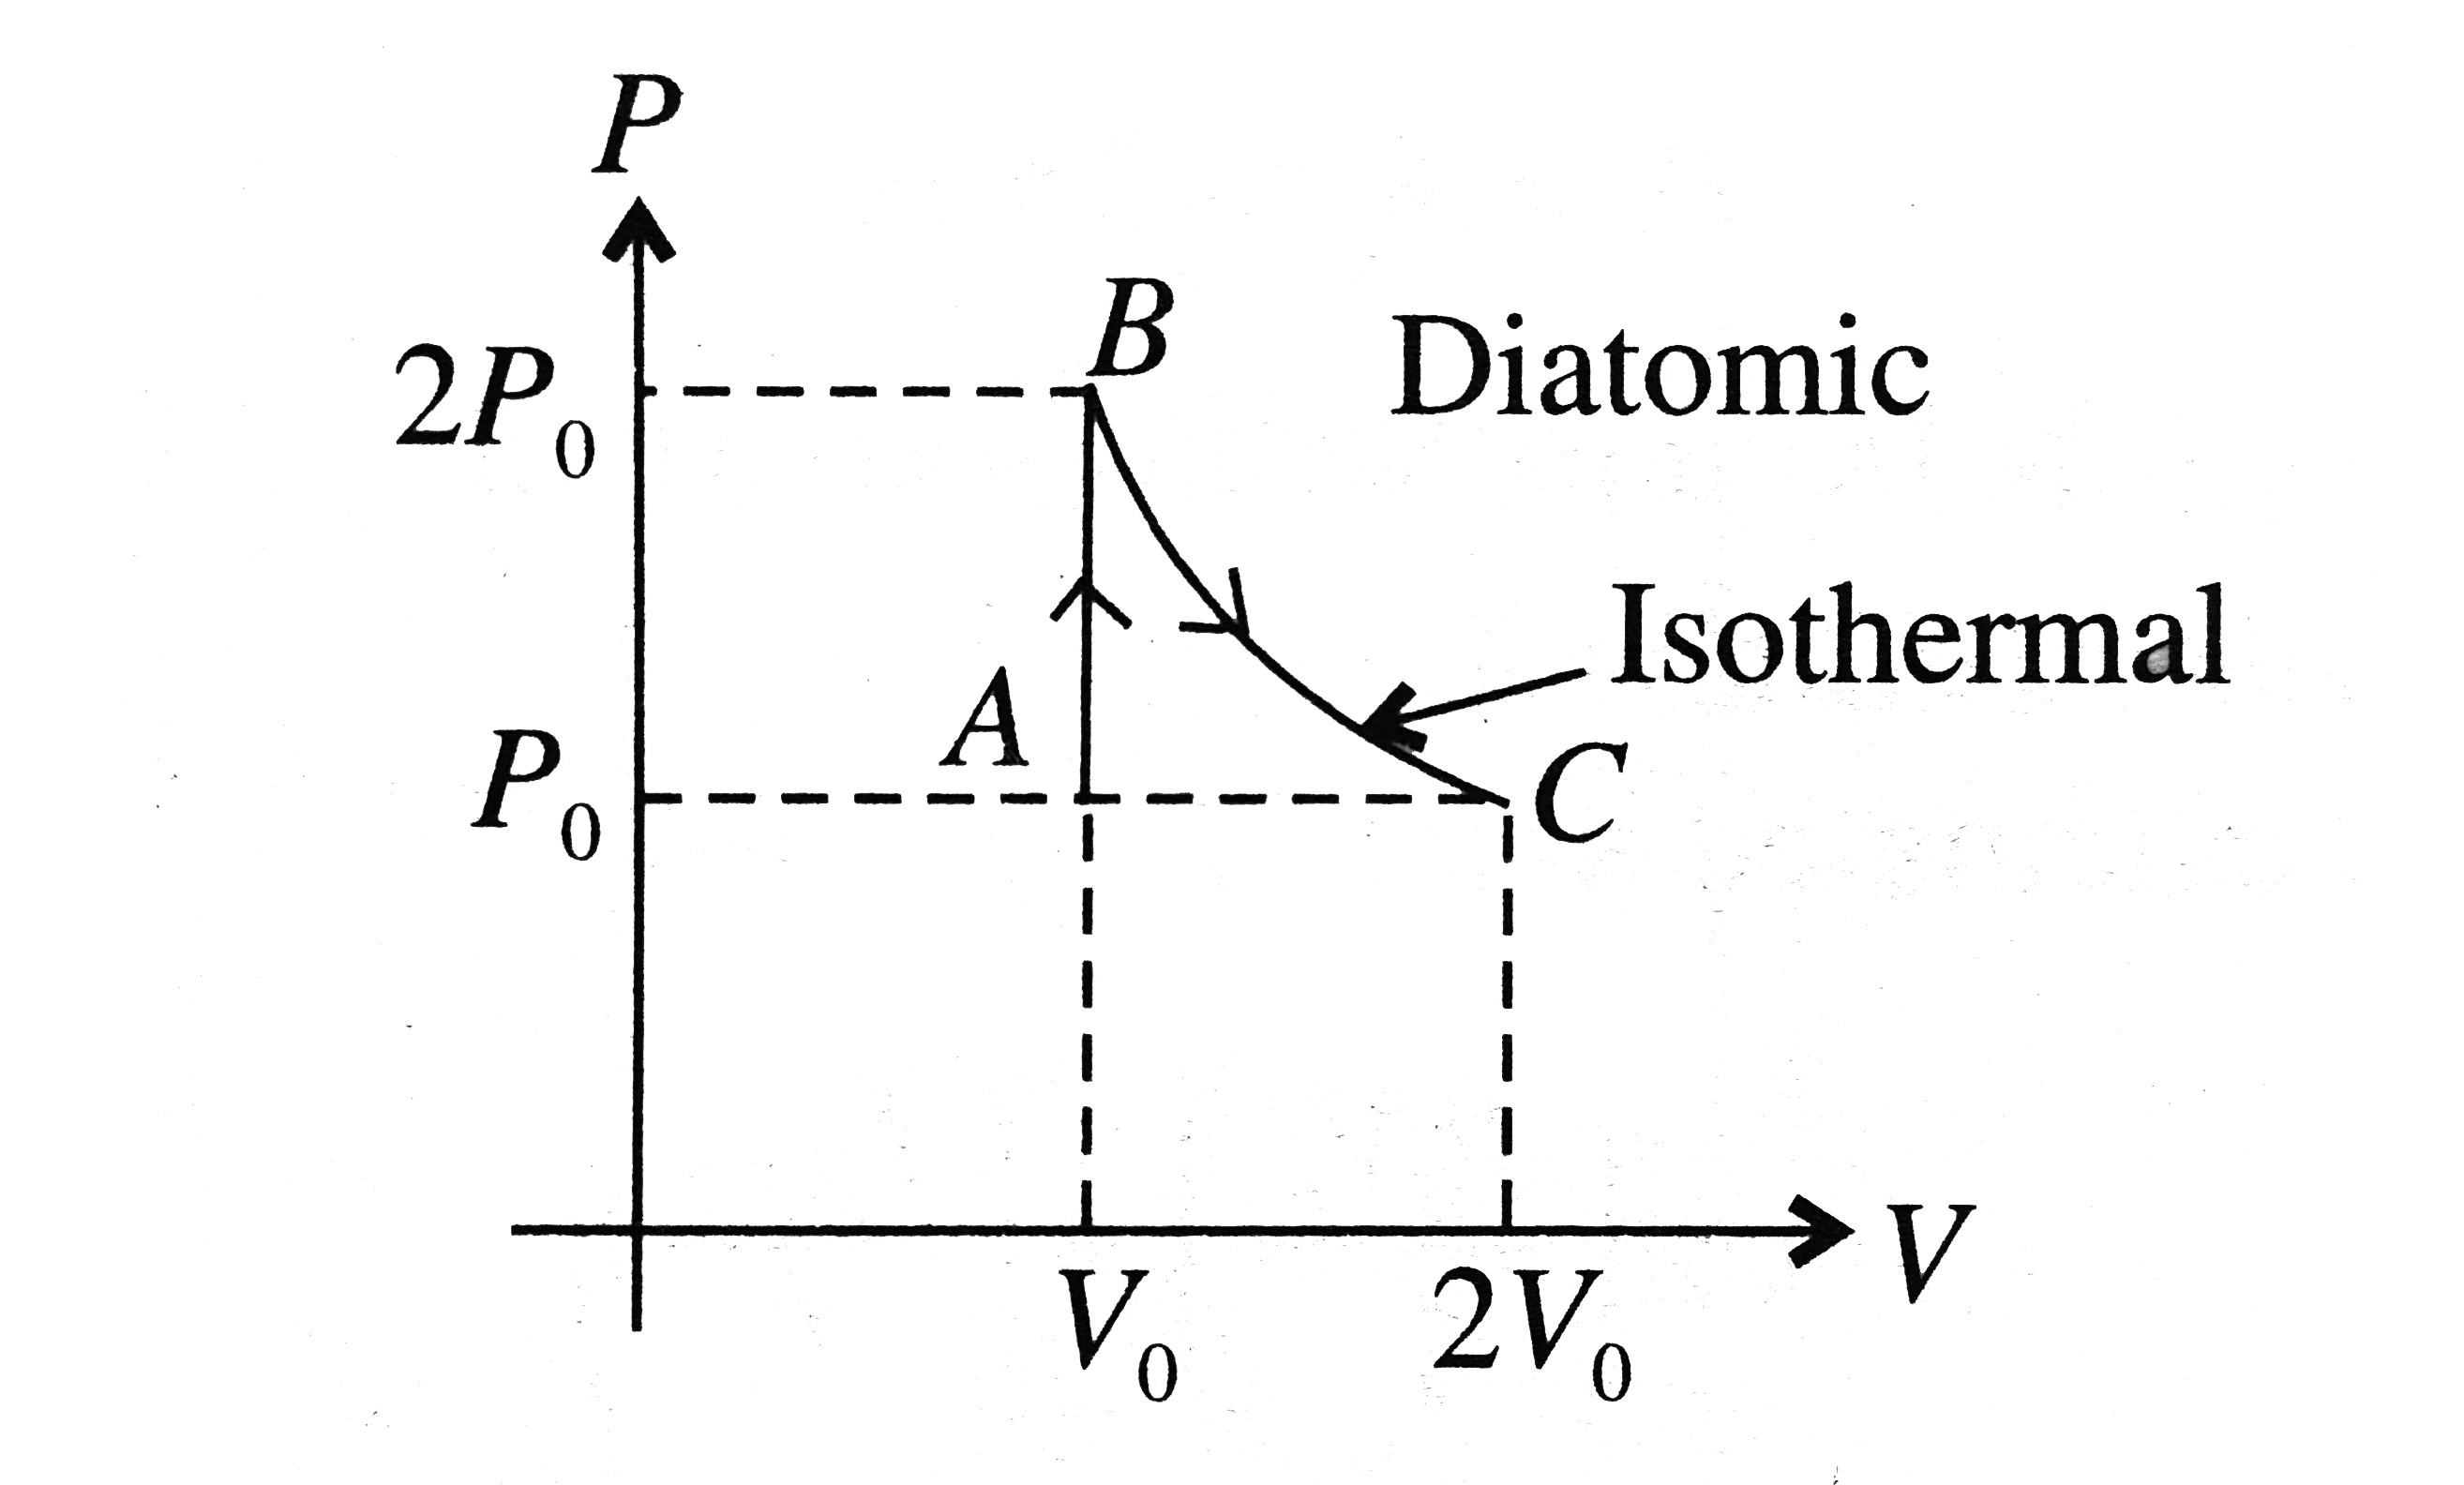
- P-V curve of a diatomic gas is shown in the Fig. Find the total heat g...
Text Solution
|
- P-V curve of a diatomic gas is shown in the Fig. Find the total heat g...
Text Solution
|
- The P - V diagram of 2 gm of helium gas for a certain process A rarr B...
Text Solution
|
- A diatomic ideal gas undergoes a thermodynamic change according to the...
Text Solution
|
- n moles of a diatomic gas has undergone a cyclic process ABC as shown ...
Text Solution
|
- A diatomic ideal gas undergoes a thermodynainic change according to th...
Text Solution
|
- An ideal gas is taken through the cycle A rarr B rarr C rarr A , as sh...
Text Solution
|
- P-V diagram of an ideal gas for a process ABC is as shown in the figur...
Text Solution
|
- In a cyclic process shown in the figure on ideal gas is adiabatically ...
Text Solution
|