


Similar Questions
Explore conceptually related problems
Recommended Questions
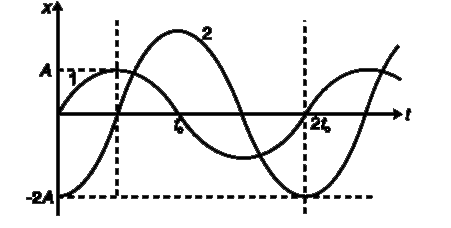
- The position time graph for two particles- 1 and 2- performing SHM al...
Text Solution
|
- Two particles are performing SHM in same phase. It means that
Text Solution
|
- The acceleration versus displacement graph of a particle performing SH...
Text Solution
|
- The displacement-time graph for two particles is as shown. Find the ra...
Text Solution
|
- Two particles are performing SHM with same amplitude and time period. ...
Text Solution
|
- The position time graph for two particles- 1 and 2- performing SHM al...
Text Solution
|
- Two particles are in SHM along same line with same amplitude A and sam...
Text Solution
|
- Velocity-time graph of a particle in SHM is as shown in figure. Match ...
Text Solution
|
- The velocity versus time graph of two particles moving along x-axis va...
Text Solution
|