


Similar Questions
Explore conceptually related problems
Recommended Questions
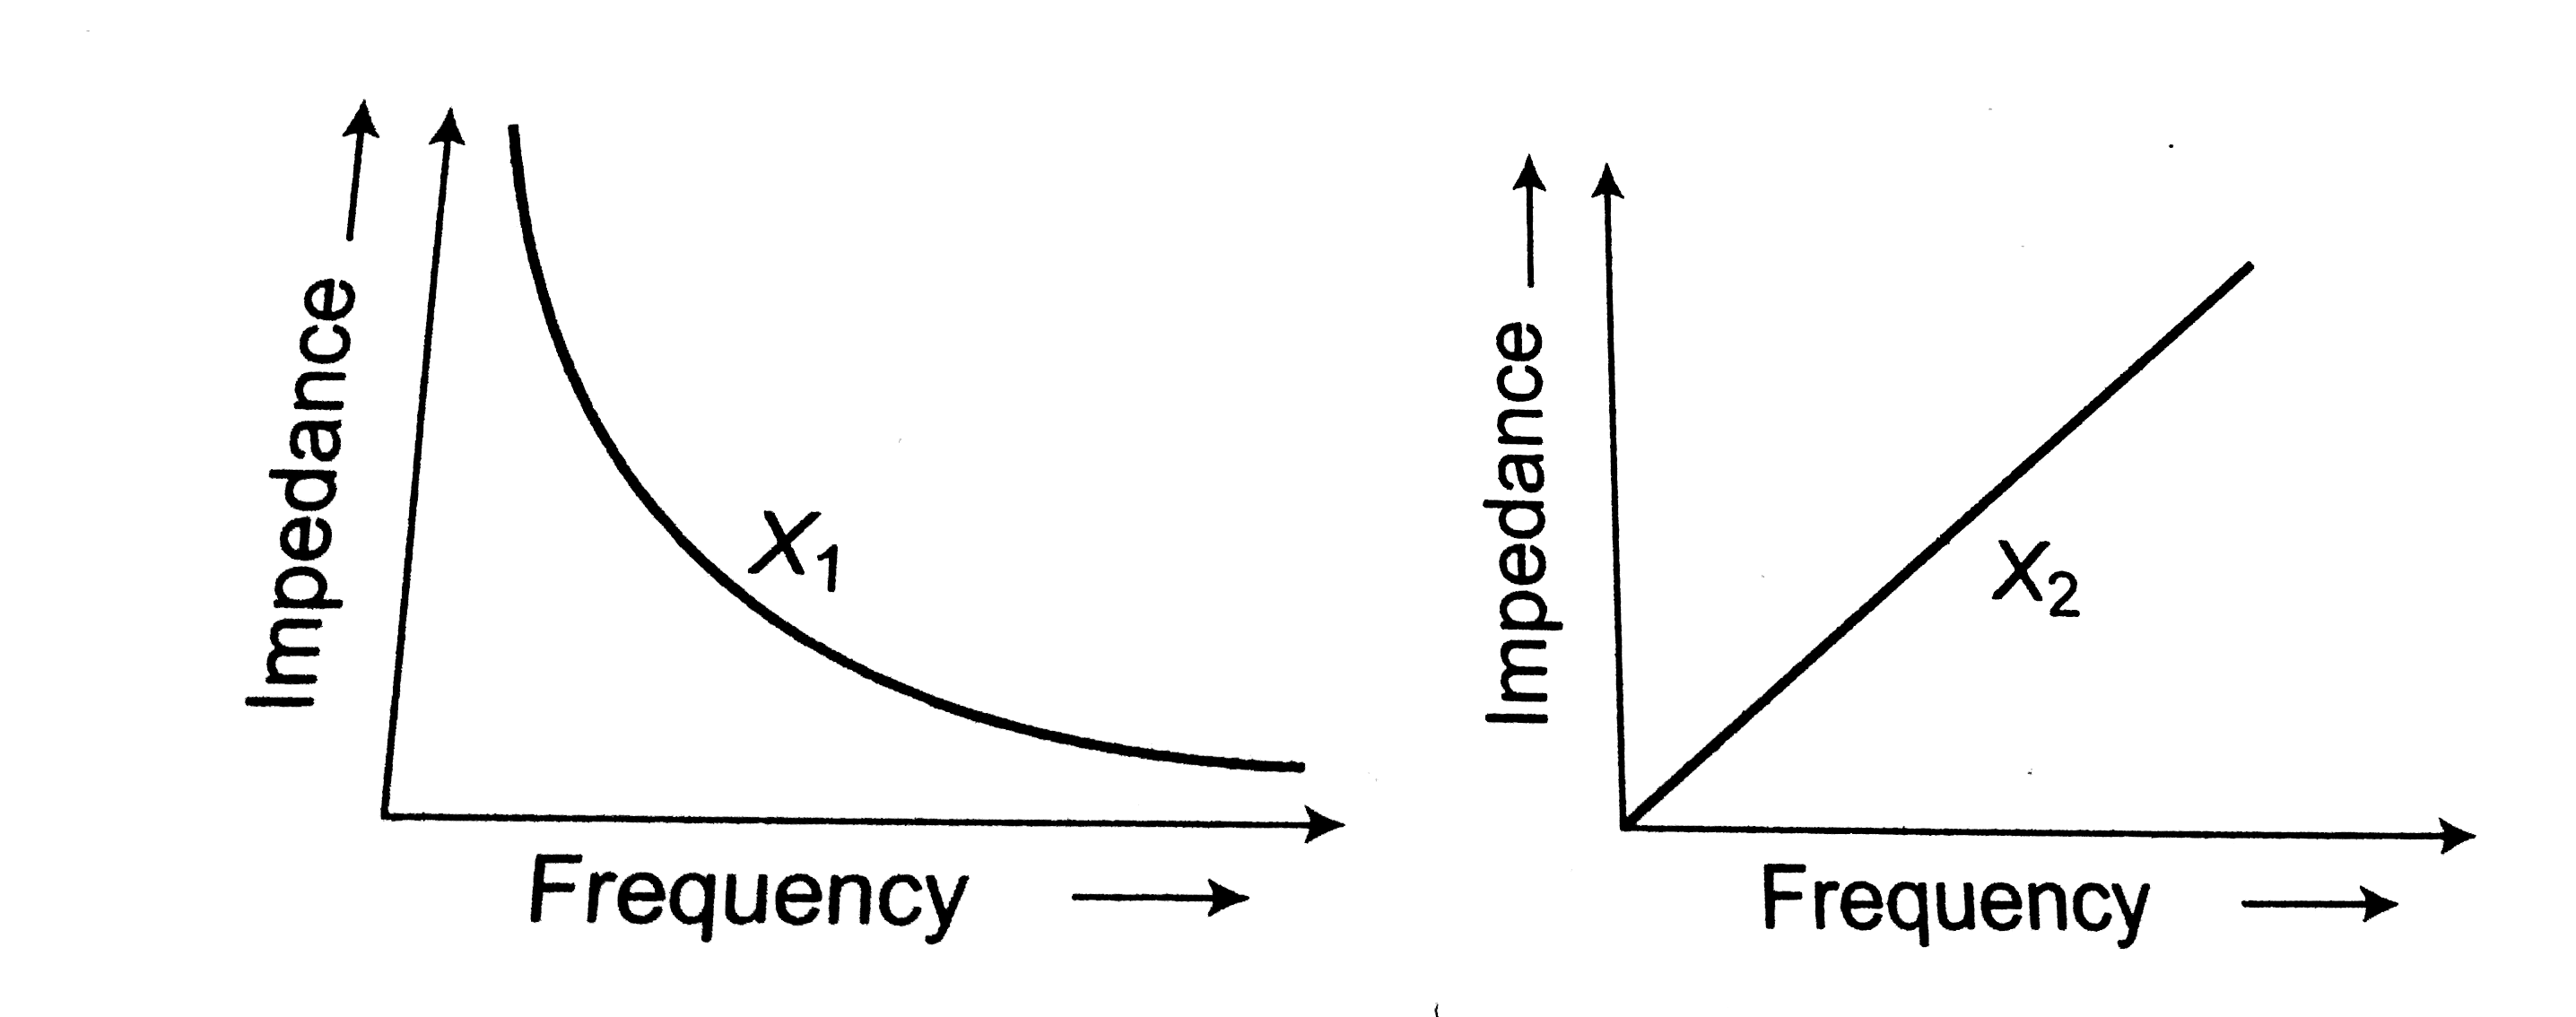
- The graphs given below depict the dependence of two reactive impedence...
Text Solution
|
- If N is any four digit number say x(1),x(2),x(3),x(4) then the maximum...
Text Solution
|
- The equation x^(log(3)x)=(x^(3))/(9) has two solutions,say x(1) and x(...
Text Solution
|
- The graphs given below depict the dependence of two reactive impedance...
Text Solution
|
- Assertion: In L-C-R series AC circut, X(L)= X(C) = R at a given freque...
Text Solution
|
- If x(1),x(2) "are two solutions of" X^(lnx^(2) )=e^(18) "then product...
Text Solution
|
- Value of |{:(1+x(1),,1+x(1)x,,1+x(1)x^(2)),(1+x(2),,1+x(2)x,,1+x(2)x^(...
Text Solution
|
- Value of |{:(1+x(1),1+x(1)x,1+x(1)x^(2)),(1+x(2),1+x(2)x,1+x(2)x^(2)),...
Text Solution
|
- If (x(1), y(1)) and (x(2), y(2)) are solutions to the system of equati...
Text Solution
|