


Similar Questions
Explore conceptually related problems
Recommended Questions
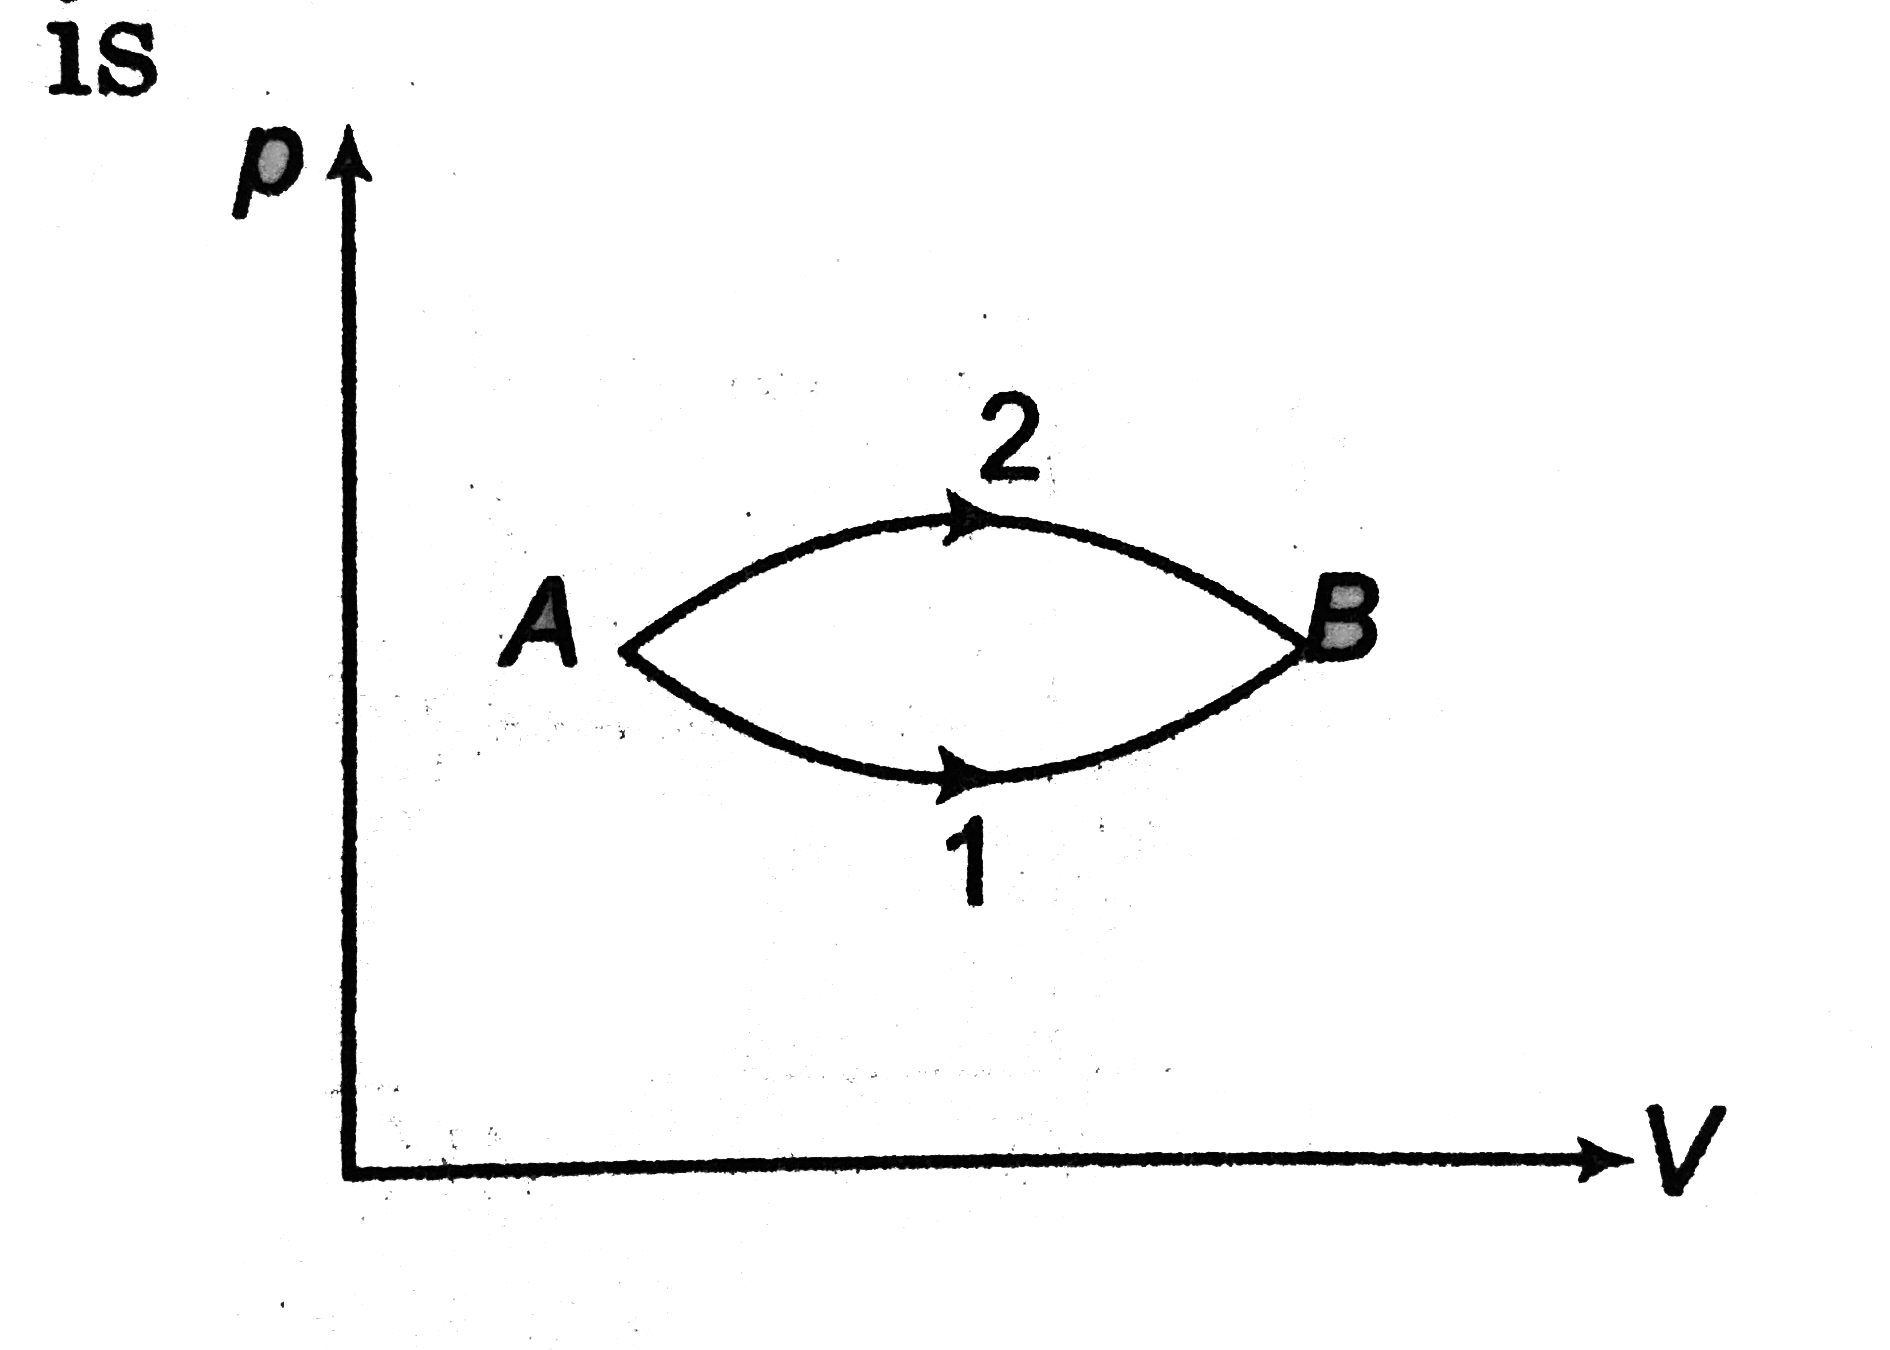
- The figure shows two paths for the change of state of a gas from A to ...
Text Solution
|
- shows three paths through which a gas can be taken from the state A to...
Text Solution
|
- The figure shows two paths for the change of state of a gas from A to ...
Text Solution
|
- Figure. Shows an ideal gas changing its state A to state C by two diff...
Text Solution
|
- A system is changed from state A to state B by one path and from B to ...
Text Solution
|
- As shown in figure three paths through which a gas can be taken from t...
Text Solution
|
- Statement - 1 : A gas is taken from state A to state B through two dif...
Text Solution
|
- A system is changed from state A to state B by one path and from B to ...
Text Solution
|
- In the given figure, an ideal gas changes its state from A to C by fou...
Text Solution
|