


Similar Questions
Explore conceptually related problems
Recommended Questions
- Using the given graph showing concentration of reactants and Products ...
Text Solution
|
- For a reaction 3A rarr Products, it is found that the rate of reaction...
Text Solution
|
- Using the given graph showing concentration of reactants and Products ...
Text Solution
|
- If doubling the concentration of a reactant X in a reaction X+Y rarr P...
Text Solution
|
- For a reaction, 3A rarr Products, it is found that the rate of reactio...
Text Solution
|
- Show that the time t(1//2)//t(3//4) for n^(th) order reaction is a fun...
Text Solution
|
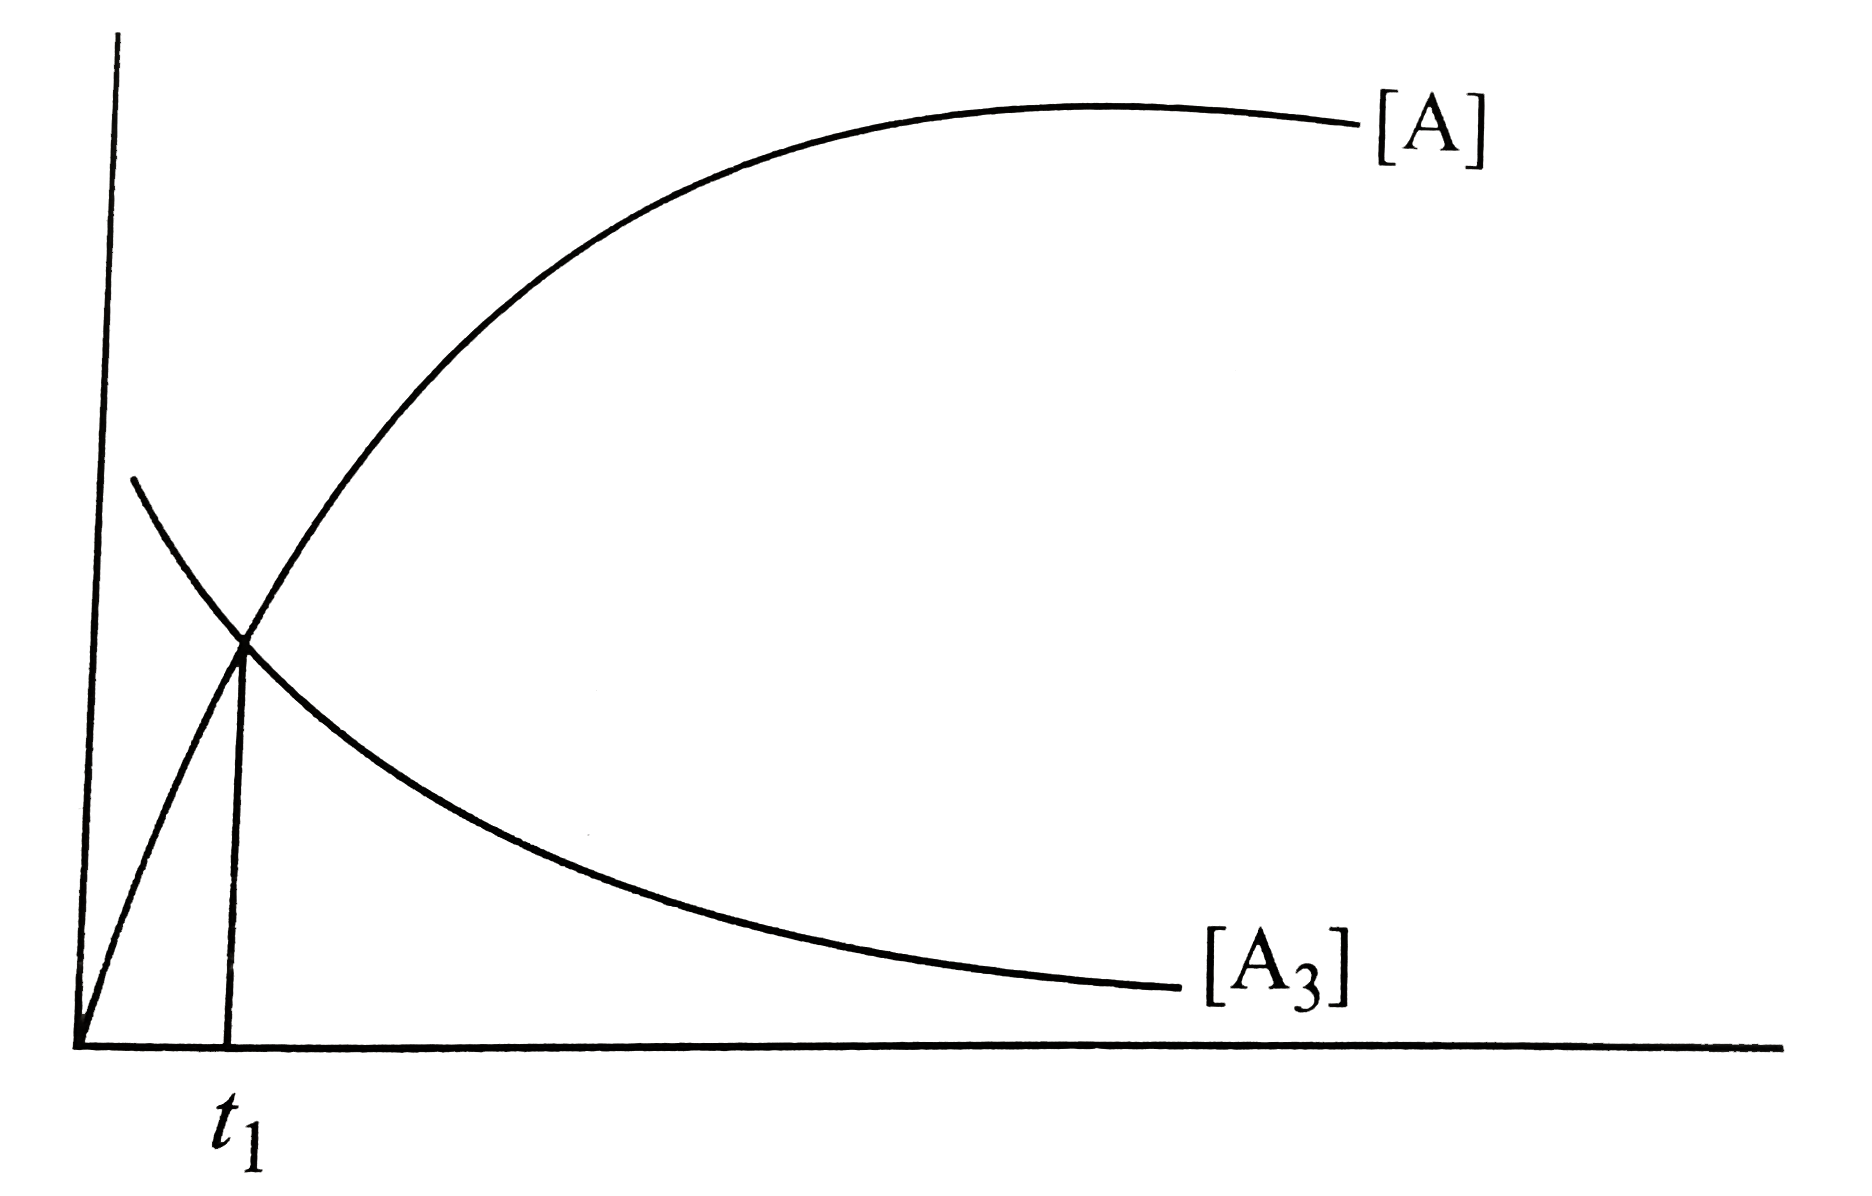
- For a first order reaction: A(3) rarr 3A, Following graph is observed ...
Text Solution
|
- Consider the reaction : A rarr B . The concentration of both reactant ...
Text Solution
|
- Graph between concentration of the product and time of the reaction A ...
Text Solution
|