


Similar Questions
Explore conceptually related problems
Recommended Questions
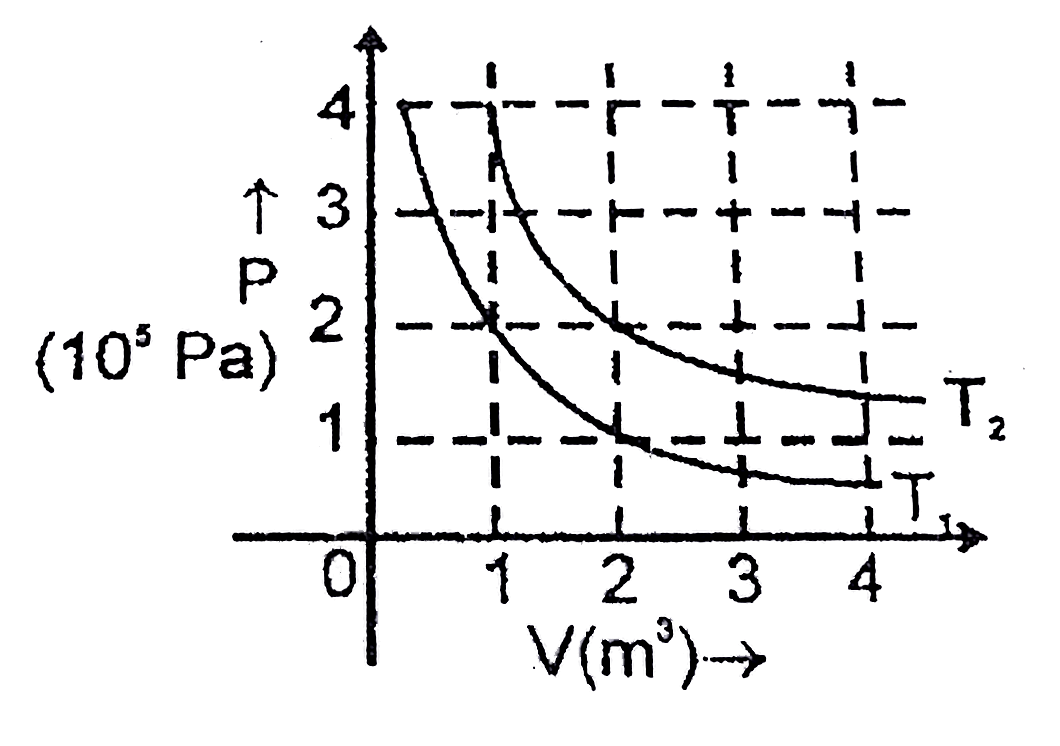
- The following graphs shows two isotherms for a fixed mass of an ideal ...
Text Solution
|
- Figure shows graphs of pressure vs density for an ideal gas at two tem...
Text Solution
|
- Figure shows graphs of pressure versus density for an ideal gas at two...
Text Solution
|
- The following graphs shows two isotherms for a fixed mass of an ideal ...
Text Solution
|
- I,II,III are three isotherms respectively at T(1),T(2) and T(3) for a ...
Text Solution
|
- Figure shows graphs of pressure vs density for an ideal gas at two tem...
Text Solution
|
- Figure shows graphs of pressure vs density for an ideal gas at two tem...
Text Solution
|
- Figure shows the isotherms of fixed mass of an ideal gas at three temp...
Text Solution
|
- Isothermal curves for a given mass of gas are shown at two different t...
Text Solution
|