


Similar Questions
Explore conceptually related problems
Recommended Questions
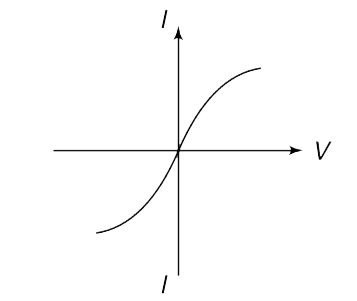
- The current-voltage graph for a resistor is as shown in the figure. Is...
Text Solution
|
- Find the currents through the three resistors shown in Figure
Text Solution
|
- Assertion : In the circuit shown in figure, current in wire ab will be...
Text Solution
|
- The current-voltage graph of a device is shown in figure. The resistan...
Text Solution
|
- In the figure shown the current through 2 Omega resistor is
Text Solution
|
- If the current supplied to a variable resistor is constant, draw a gra...
Text Solution
|
- The current-voltage graph for a resistor is as shown in the figure. Is...
Text Solution
|
- Each resistance shown in the network is in ohm. Current through the re...
Text Solution
|
- Find the currents through the three resistors shown in figure
Text Solution
|