Home
Class 11
CHEMISTRY
Which of the following plots are correct...

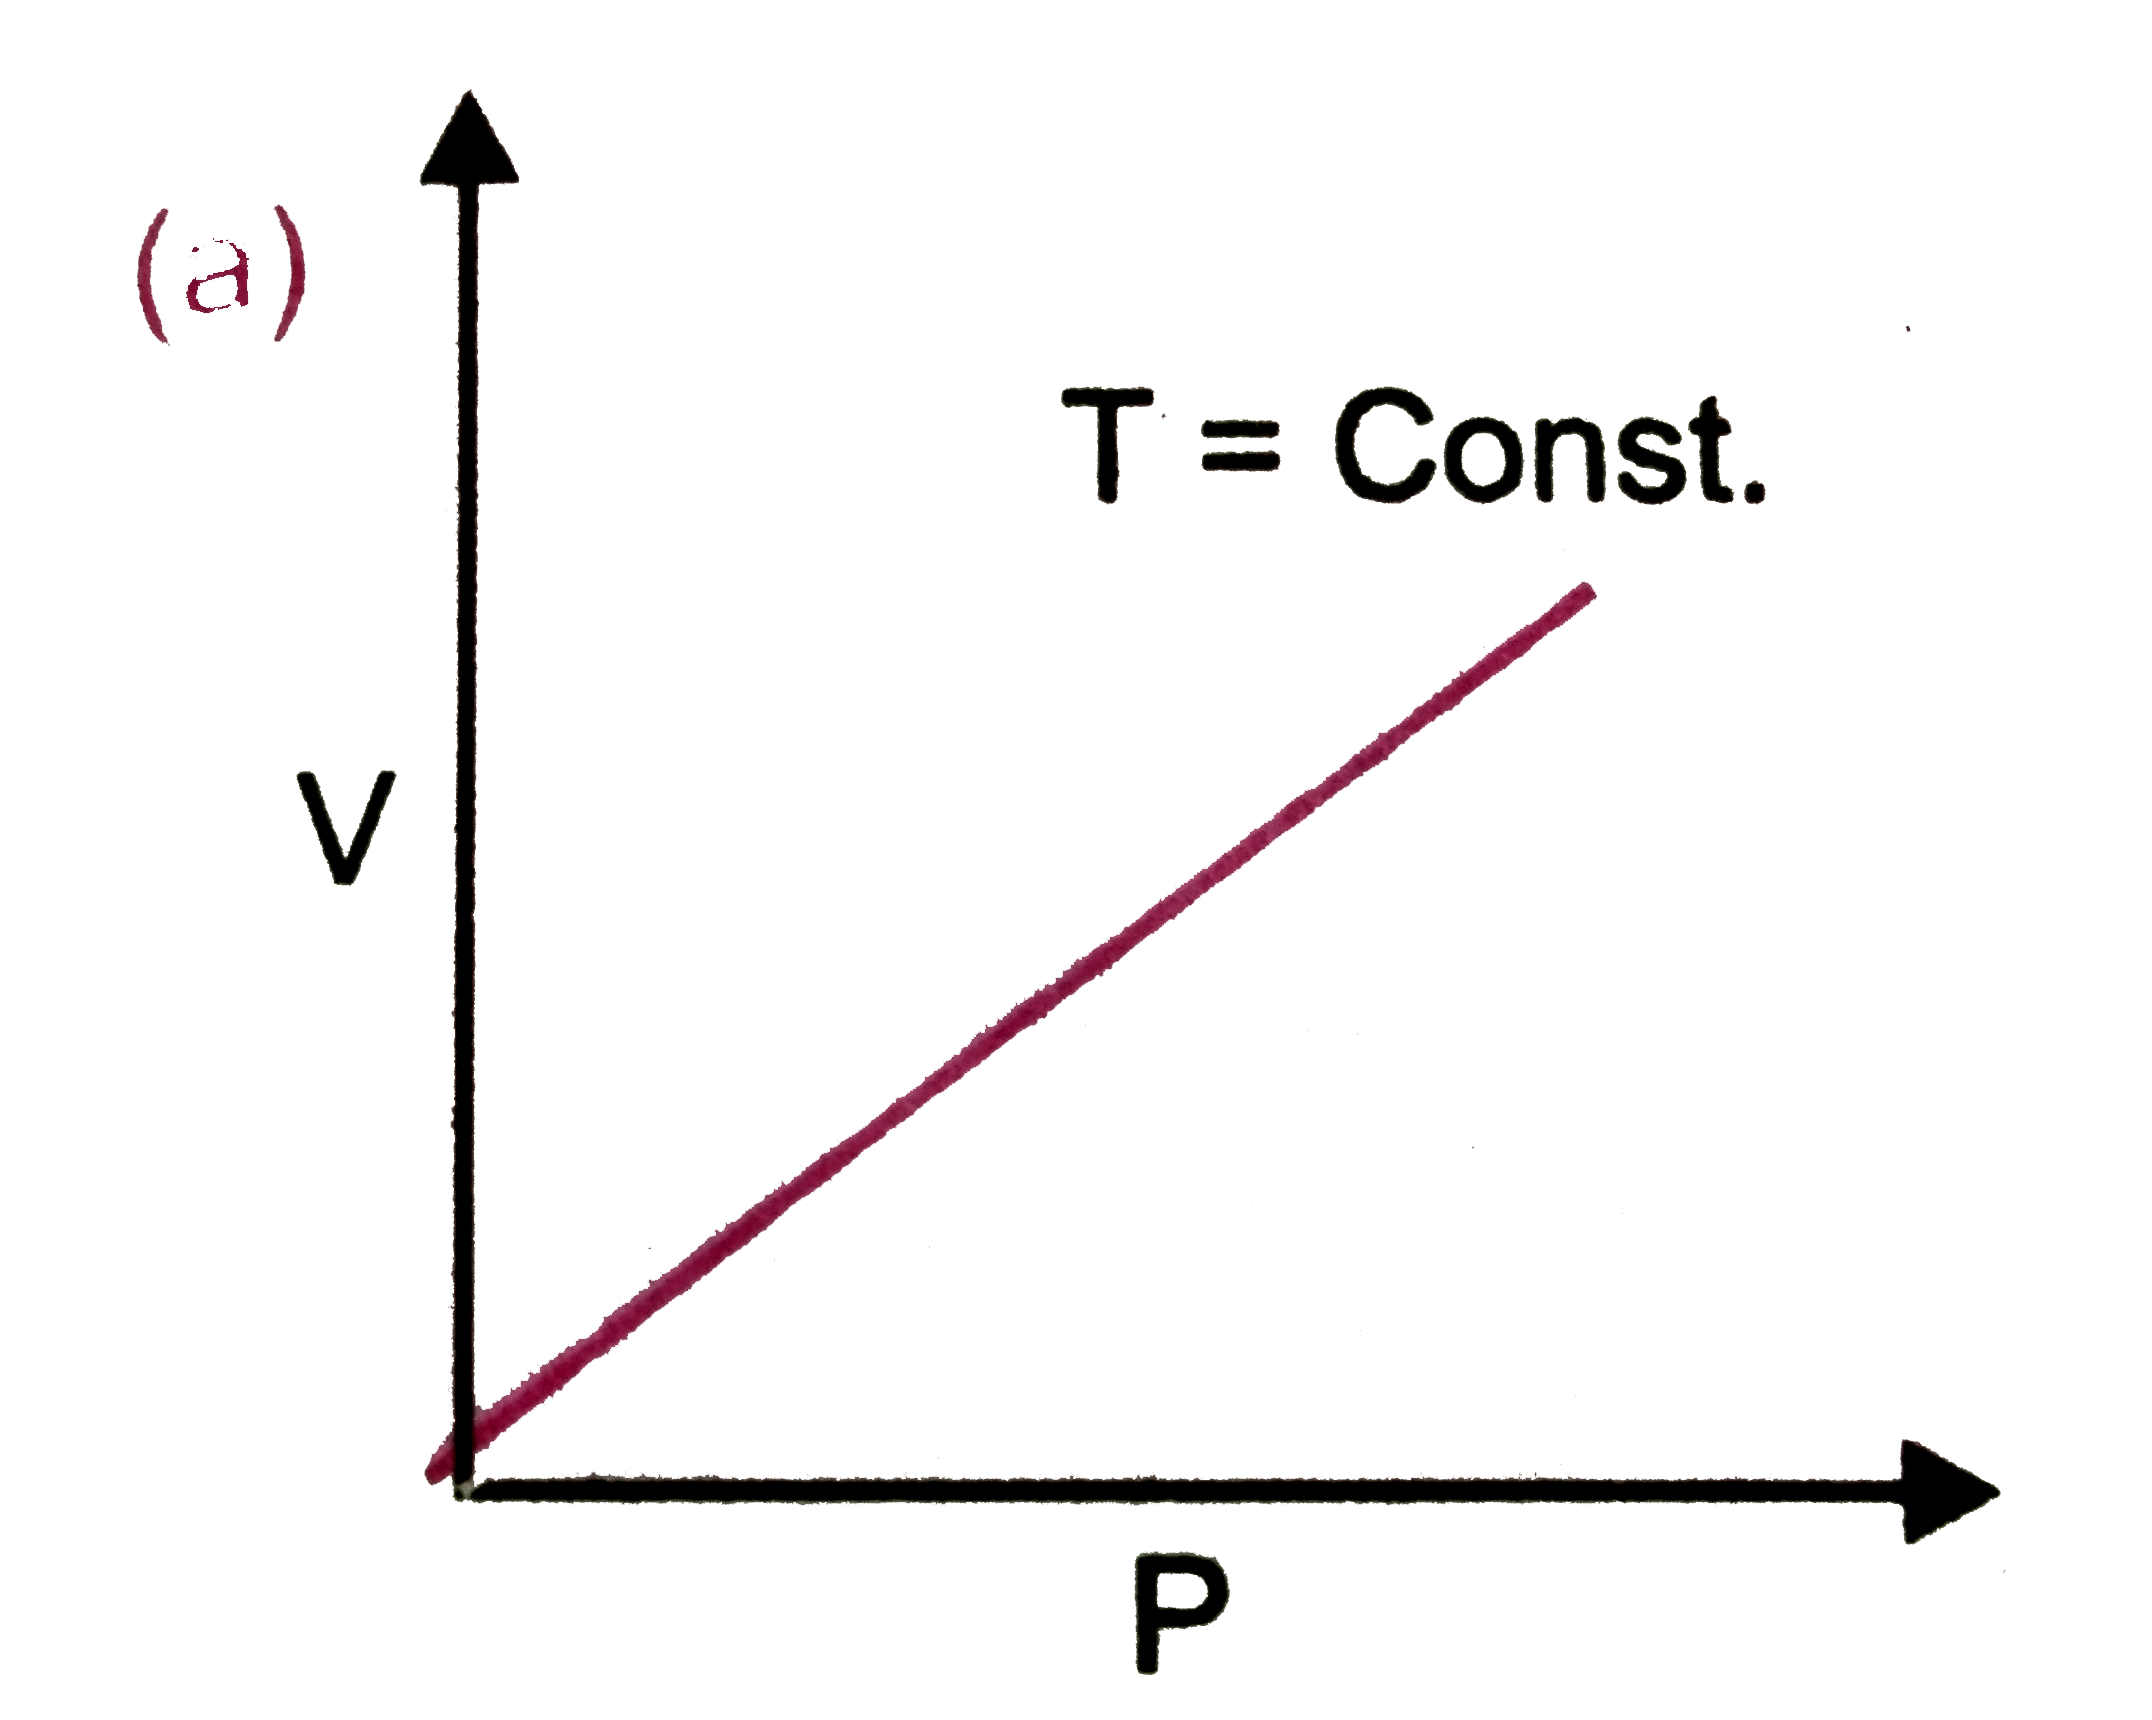
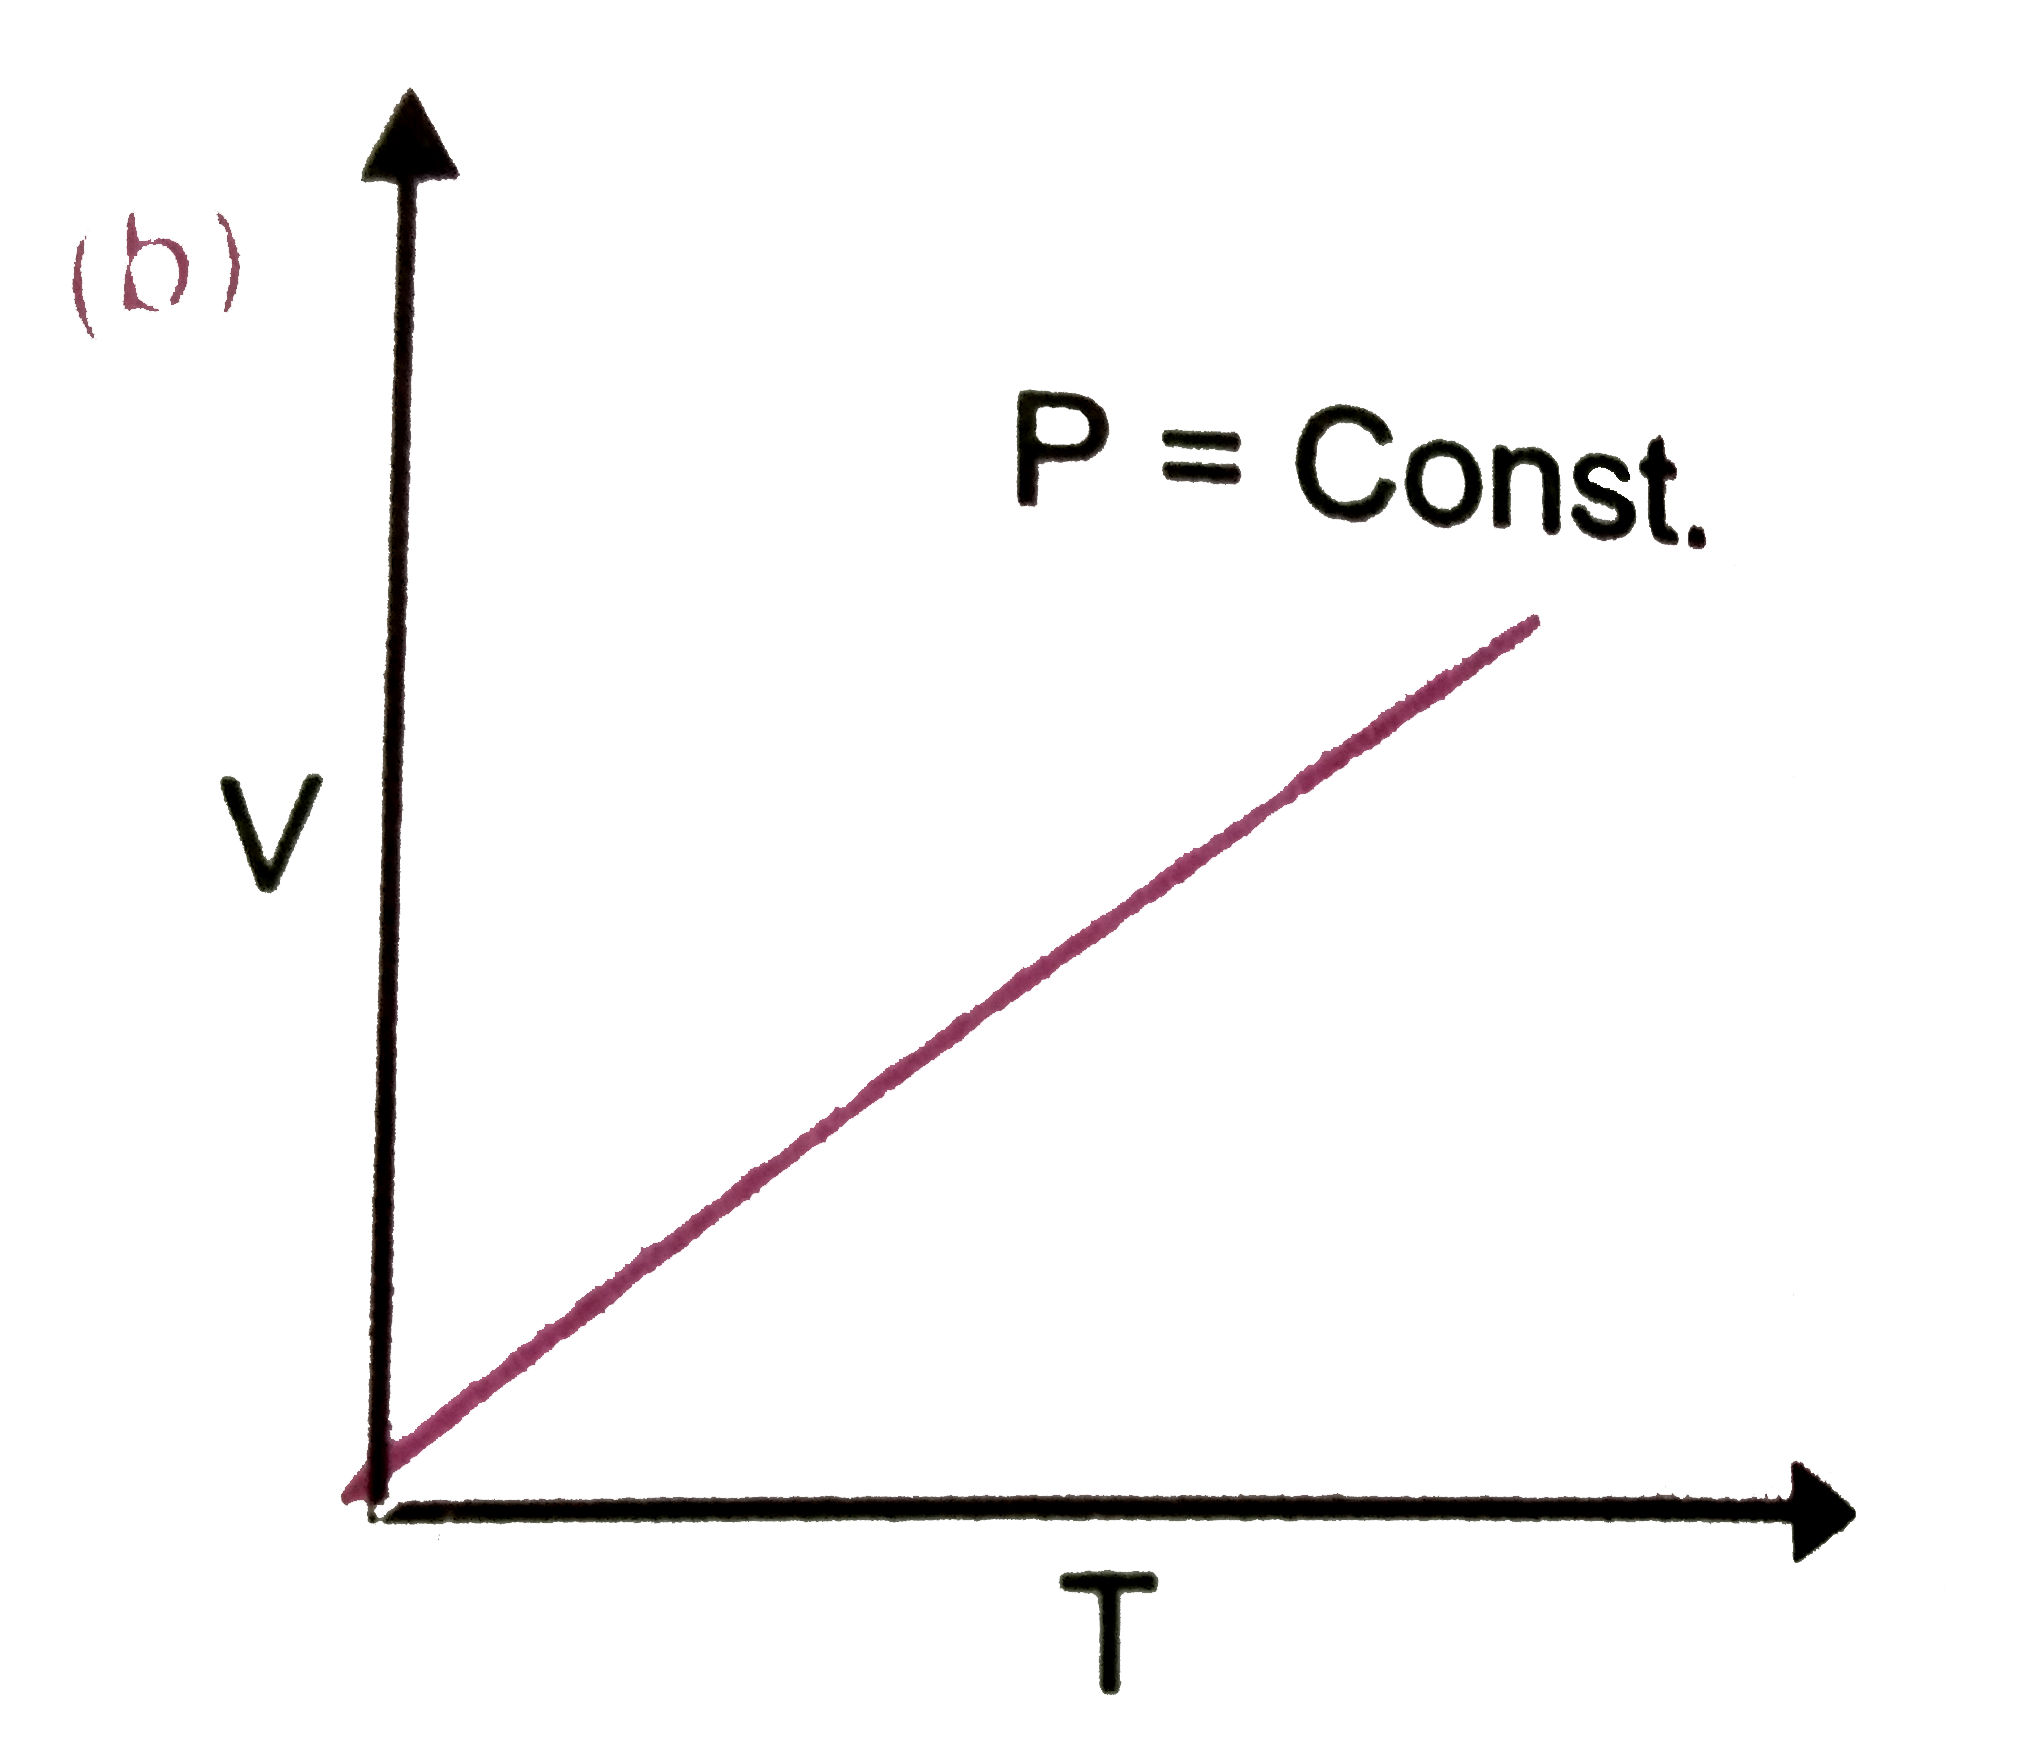
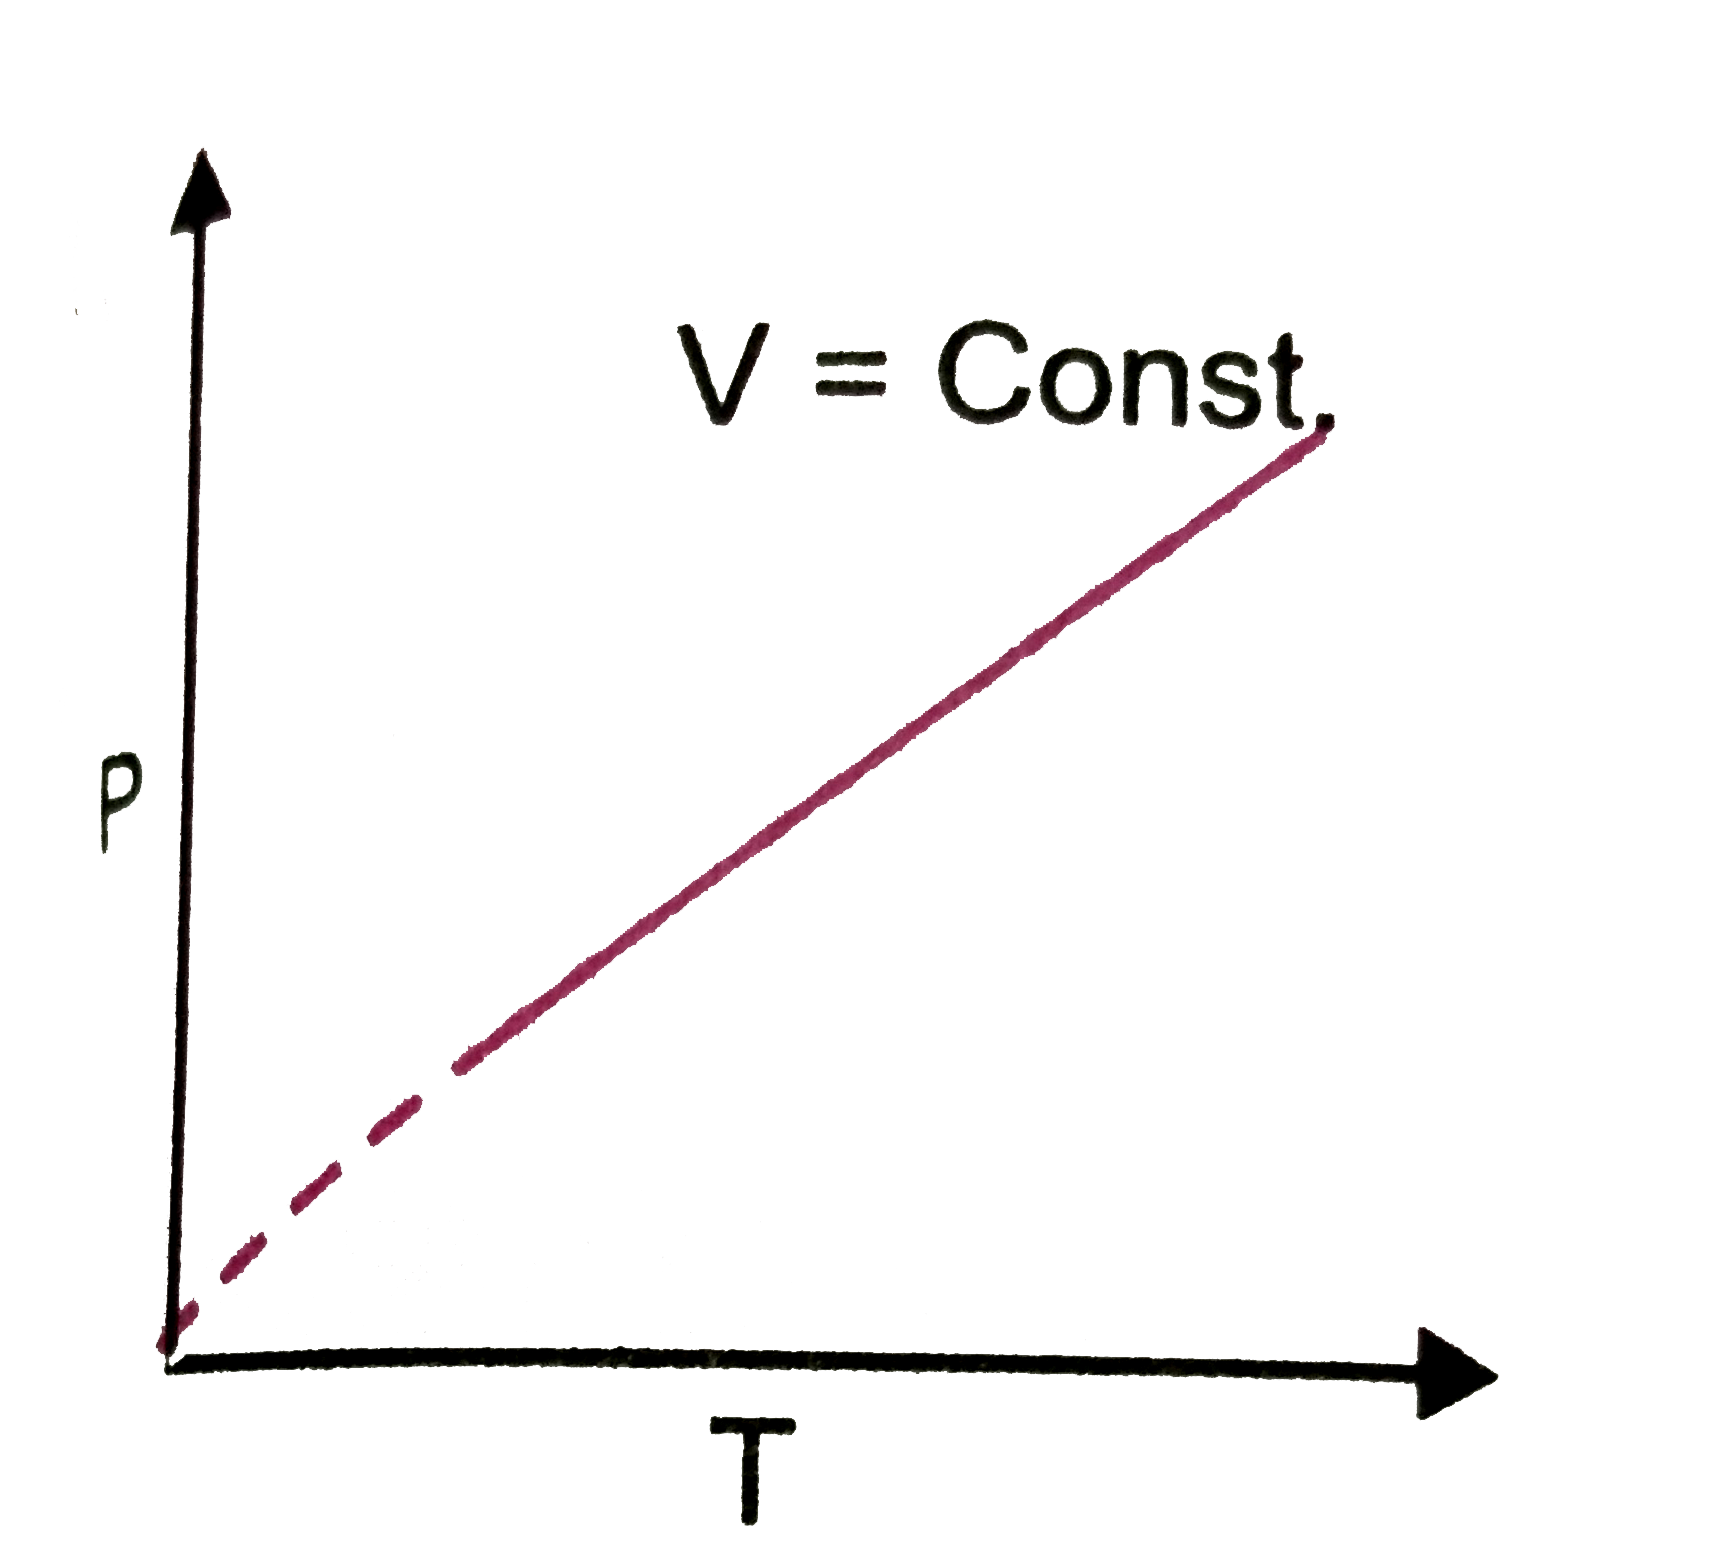
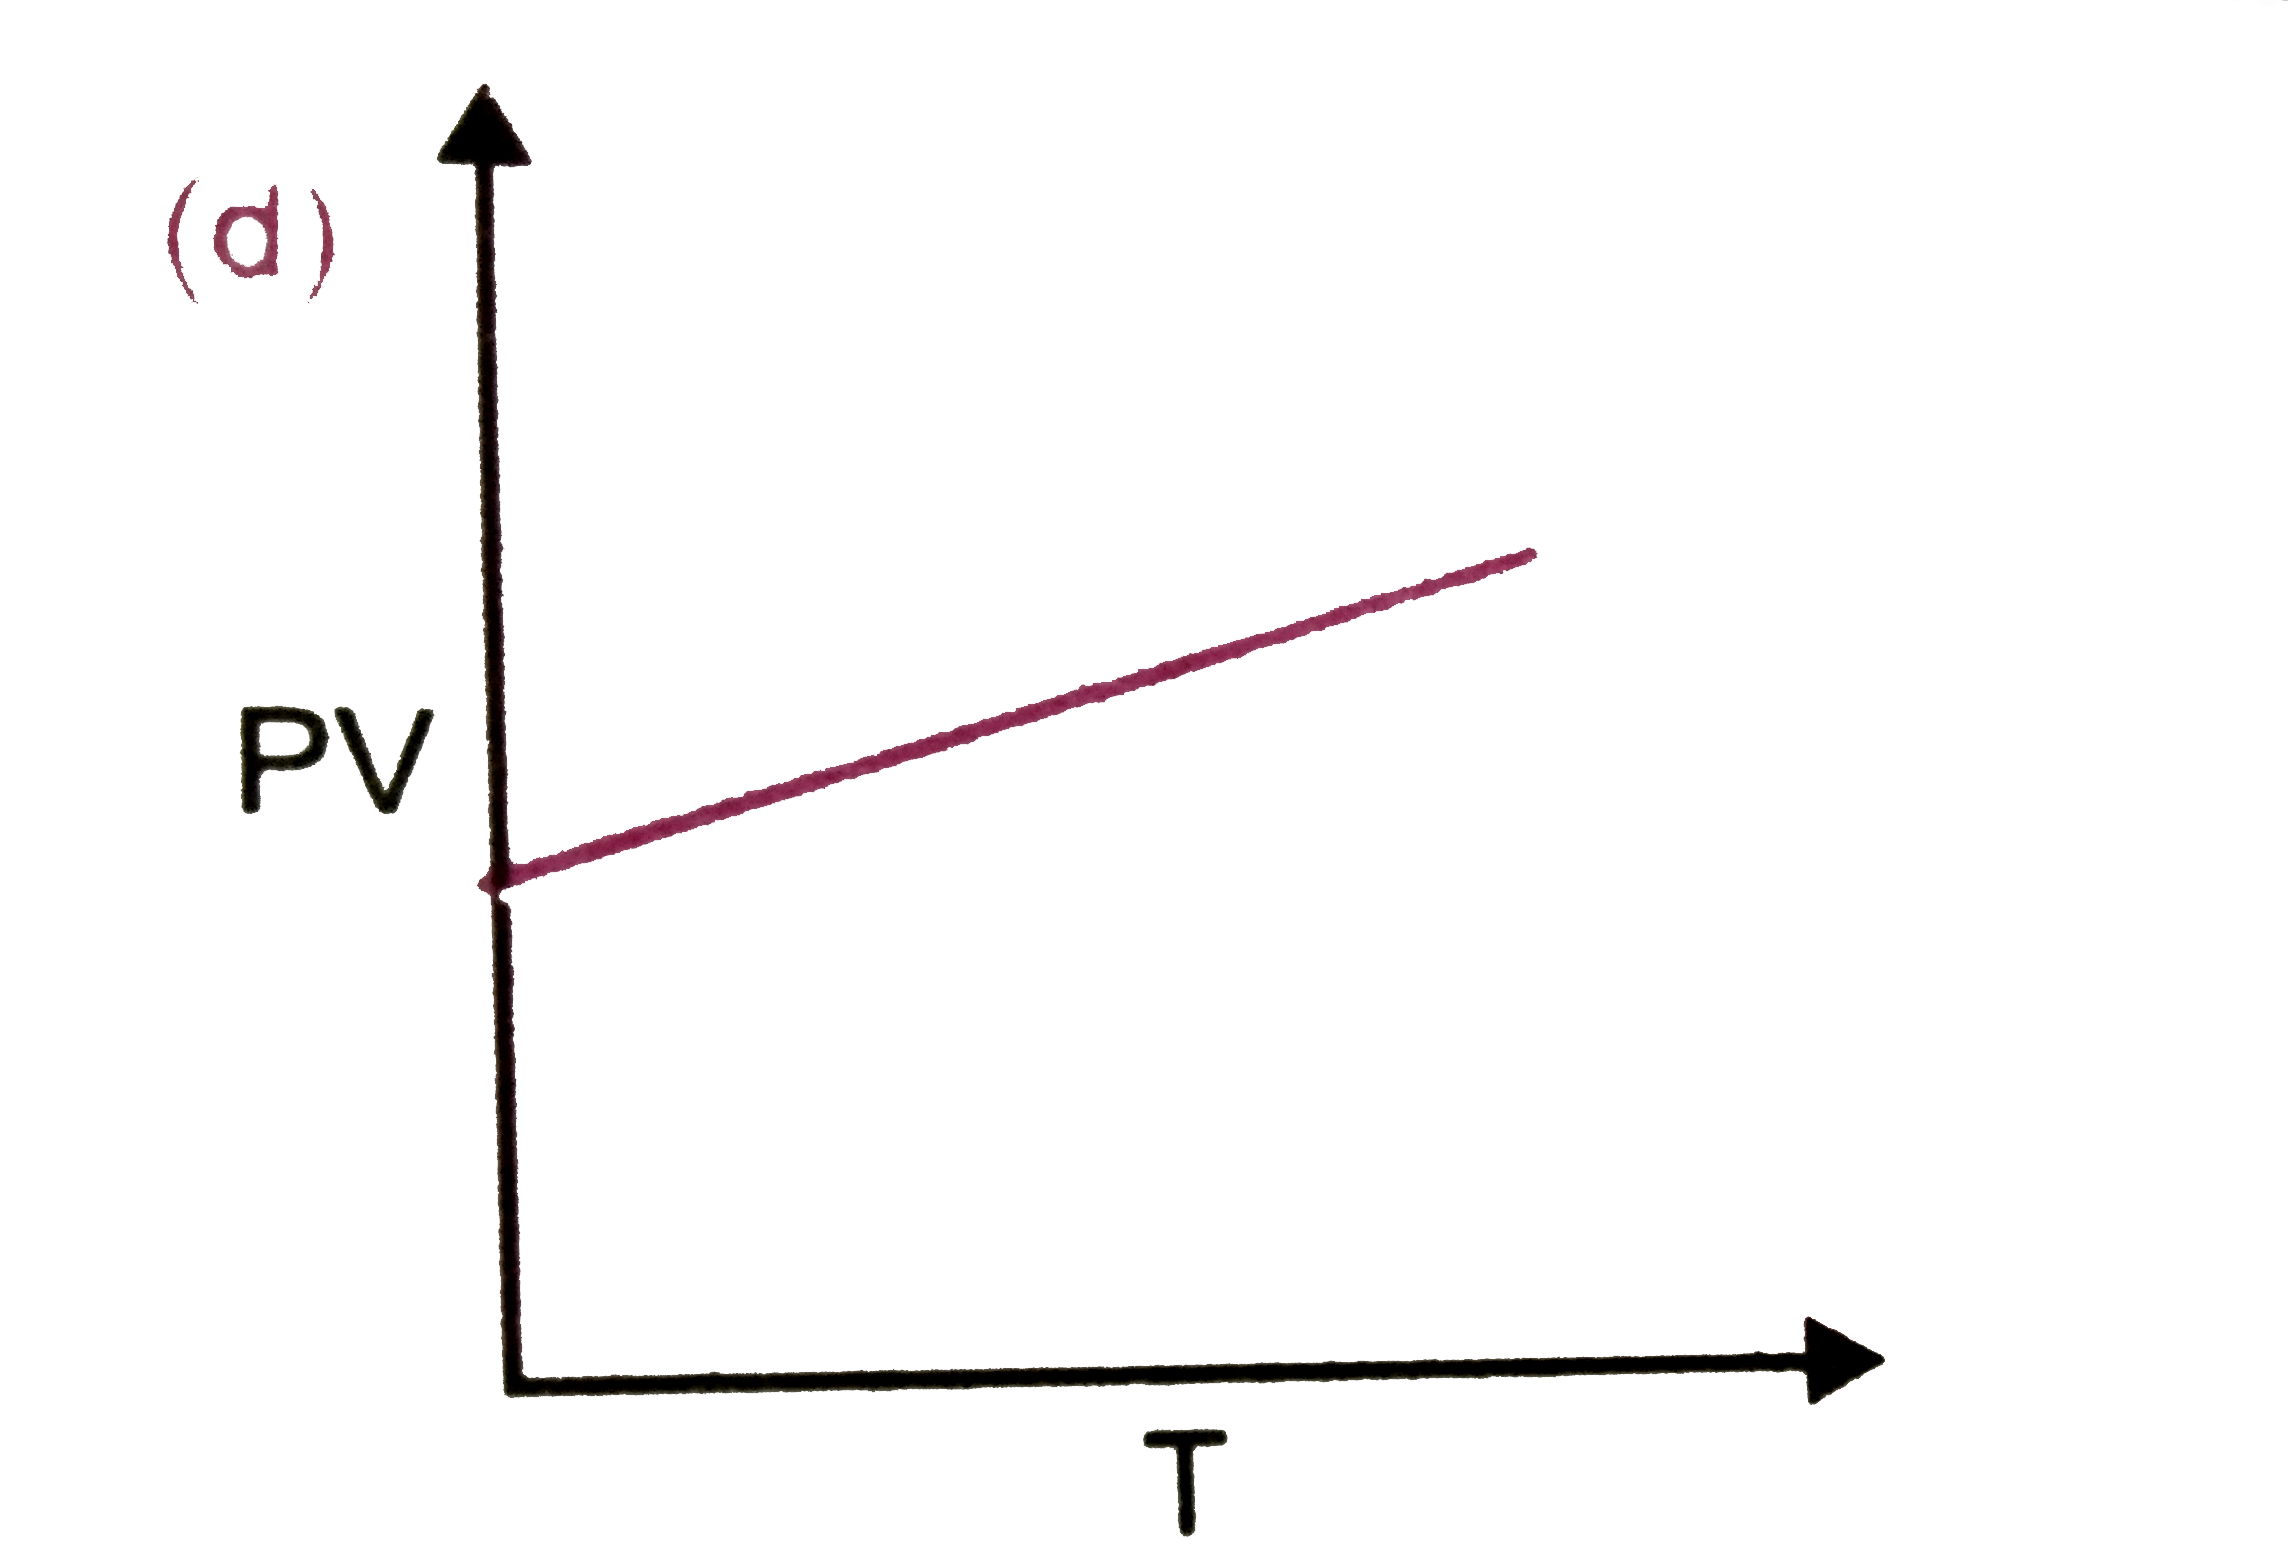
Which of the following plots are correct ?

A

B

C

D

Text Solution

AI Generated Solution

The correct Answer is:
To determine which plots are correct based on the relationships between volume (V), pressure (P), and temperature (T) in gases, we can analyze each graph step by step. ### Step-by-Step Solution: 1. **Analyze the First Graph (V vs. P at Constant T)**: - The relationship between volume (V) and pressure (P) at constant temperature (T) is given by Boyle's Law, which states that \( PV = k \) (where k is a constant). - Rearranging this gives \( V = \frac{k}{P} \). - This equation represents a hyperbolic relationship, indicating that as pressure increases, volume decreases. - **Conclusion**: The first graph is incorrect if it does not show a hyperbolic curve. 2. **Analyze the Second Graph (V vs. T at Constant P)**: - The relationship between volume (V) and temperature (T) at constant pressure (P) is given by Charles's Law, which states that \( V = kT \). - This indicates a direct linear relationship between volume and temperature. - **Conclusion**: The second graph is correct if it shows a straight line. 3. **Analyze the Third Graph (P vs. T at Constant V)**: - The relationship between pressure (P) and temperature (T) at constant volume (V) is given by Gay-Lussac's Law, which states that \( P = kT \). - This also indicates a direct linear relationship between pressure and temperature. - **Conclusion**: The third graph is correct if it shows a straight line. 4. **Analyze the Fourth Graph (P vs. V vs. T)**: - The combined gas law states that \( PV = nRT \), where n and R are constants. - If we consider \( PV \) as one variable and T as another, we can rearrange it to show that \( PV \) is directly proportional to T. - This implies a linear relationship when plotted. - **Conclusion**: The fourth graph is correct if it shows a straight line. ### Final Conclusion: - Based on the analysis: - The first graph is incorrect. - The second graph is correct. - The third graph is correct. - The fourth graph is correct. Thus, the correct options are **B, C, and D**.

To determine which plots are correct based on the relationships between volume (V), pressure (P), and temperature (T) in gases, we can analyze each graph step by step. ### Step-by-Step Solution: 1. **Analyze the First Graph (V vs. P at Constant T)**: - The relationship between volume (V) and pressure (P) at constant temperature (T) is given by Boyle's Law, which states that \( PV = k \) (where k is a constant). - Rearranging this gives \( V = \frac{k}{P} \). - This equation represents a hyperbolic relationship, indicating that as pressure increases, volume decreases. ...
Promotional Banner

Topper's Solved these Questions

  • STATES OF MATTER : GASES AND LIQUIDES

    PRADEEP|Exercise III. Multiple Choice Questions|7 Videos
  • STATES OF MATTER : GASES AND LIQUIDES

    PRADEEP|Exercise IV MATCHING TYPE QUESTIONS|1 Videos
  • STATES OF MATTER : GASES AND LIQUIDES

    PRADEEP|Exercise COMPETITION FOCUS (Miscellaneous)|6 Videos
  • SOME p-BLOCK ELEMENTS

    PRADEEP|Exercise Competition Focus (JEE( Main and Advanced)/Medical Entrance) VIII. Assertion-Reason Type Questions (Type I)|23 Videos
  • STATES OF MATTER: SOLID MATTER

    PRADEEP|Exercise COMPETITION FOCUS (ASSERTION-REASON)|17 Videos

Similar Questions

Explore conceptually related problems

Which of the following plots is/are correct?

Which of the following plots is/are correct?

Which of the following plots is/are correctly labelled ?

Shown below are the black body radiation curves at temperature T_(1) and T_(2) (T_(2) gt T_(1)) . Which of the following plots is correct?

The mass of argon adsorbed per unit mass of carbon surface is plotted against pressure. Which of the following plots is correct if x and m represent the masses of argon and carbon respectively ? (………. Represents extrapolated data)

Which of the following plots is(are) correct for the given reaction? ( [P]_0 is the initial consentration of P)

For gaseous state at constant temperature which of the following plot is correct?

Which of the following plot is correct about the kinetic energy of photoelectrons ?