


Similar Questions
Explore conceptually related problems
Recommended Questions
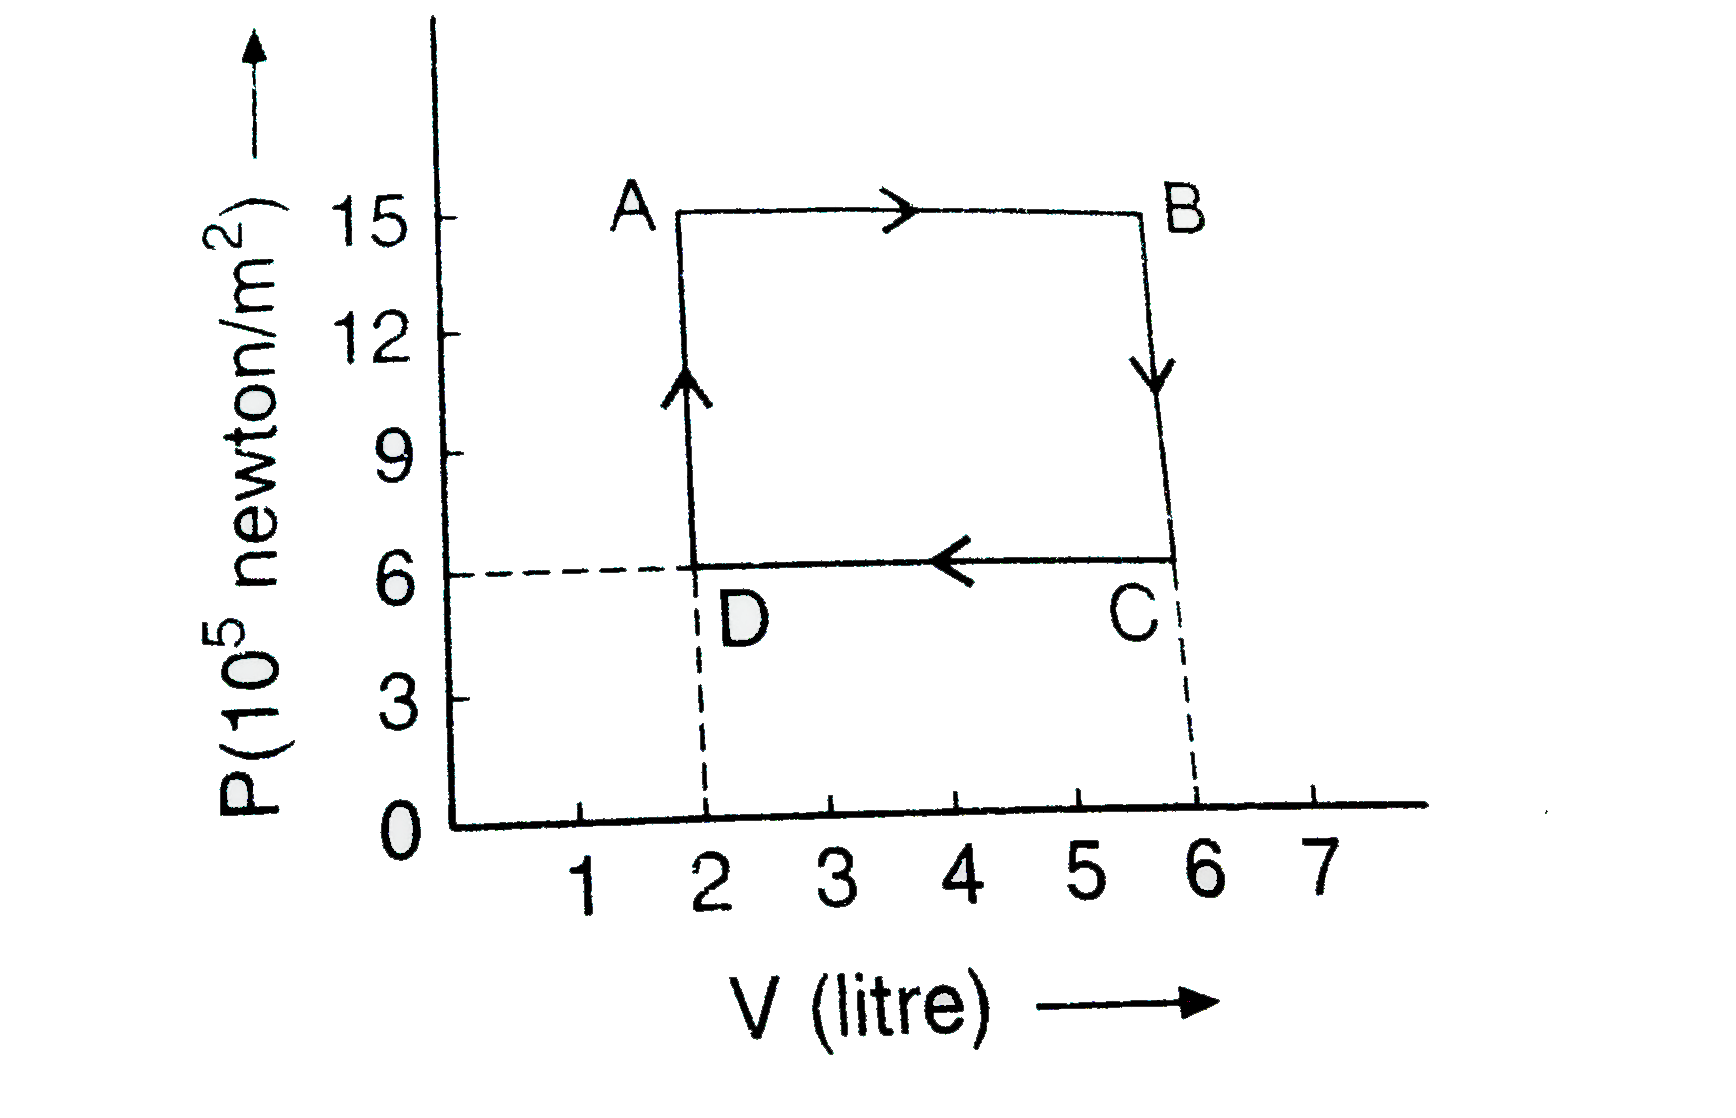
- In the adjoining diagram, the p-V graph of an ideal gas is shown. Find...
Text Solution
|
- Two moles of helium gas are taken over the cycle ABCDA , as sh...
Text Solution
|
- The diagram shows a PV graph of a thermodynamic behavious of an ideal ...
Text Solution
|
- In the adjoining diagram, the p-V graph of an ideal gas is shown. Find...
Text Solution
|
- चित्र में, किसी गैस के लिए दाब-आयतन आरेख (P-V diagram) दर्शावा गया है...
Text Solution
|
- चित्र में, किसी गैस के लिए दाब-आयतन आरेख (P-V diagram) दर्शाया गया है...
Text Solution
|
- चित्र में, किसी गैस के लिये दाय-आयतन आरेख दर्शाया गया है। ग्राफ से ज्...
Text Solution
|
- चित्र में, किसी गैस के लिये दाय-आयतन आरेख दर्शाया गया है। ग्राफ से ज्...
Text Solution
|
- चित्र में, किसी गैस के लिये दाय-आयतन आरेख दर्शाया गया है। ग्राफ से ज्...
Text Solution
|