


Similar Questions
Explore conceptually related problems
Recommended Questions
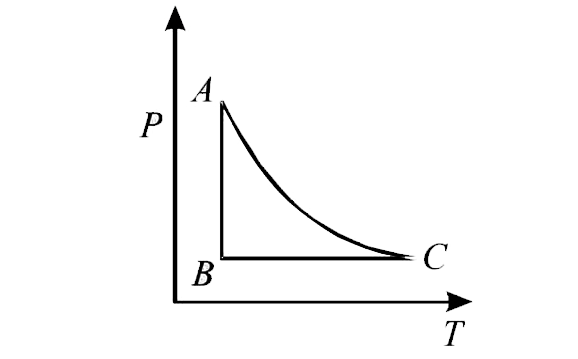
- The PT diagram for an ideal gas is shown in the figure, where AC is an...
Text Solution
|
- The PT diagram for an ideal gas is shown in the figure, where AC is an...
Text Solution
|
- An ideal gas goes through a reversible cycle ararrBrarrcrarrd has the ...
Text Solution
|
- An ideal gas undergoes a cyclic process as shown in the given P-T diag...
Text Solution
|
- An ideal gas undergoes cyclic process ACBC as shown is given PV diagra...
Text Solution
|
- PV Diagram for ideal gas in piston cylinder assembly undergoing a ther...
Text Solution
|
- Draw the PV diagram for Adiabatic process
Text Solution
|
- चित्र में, रद्धोम प्रक्रम में दो गैसों के लिए P-V आरेख दिखाये गये हैं।...
Text Solution
|
- चक्रिय प्रक्रम ABCA आरेख P-T में दर्शाया गया है। यदि इसे P-V आरेख पर प...
Text Solution
|