


Similar Questions
Explore conceptually related problems
Recommended Questions
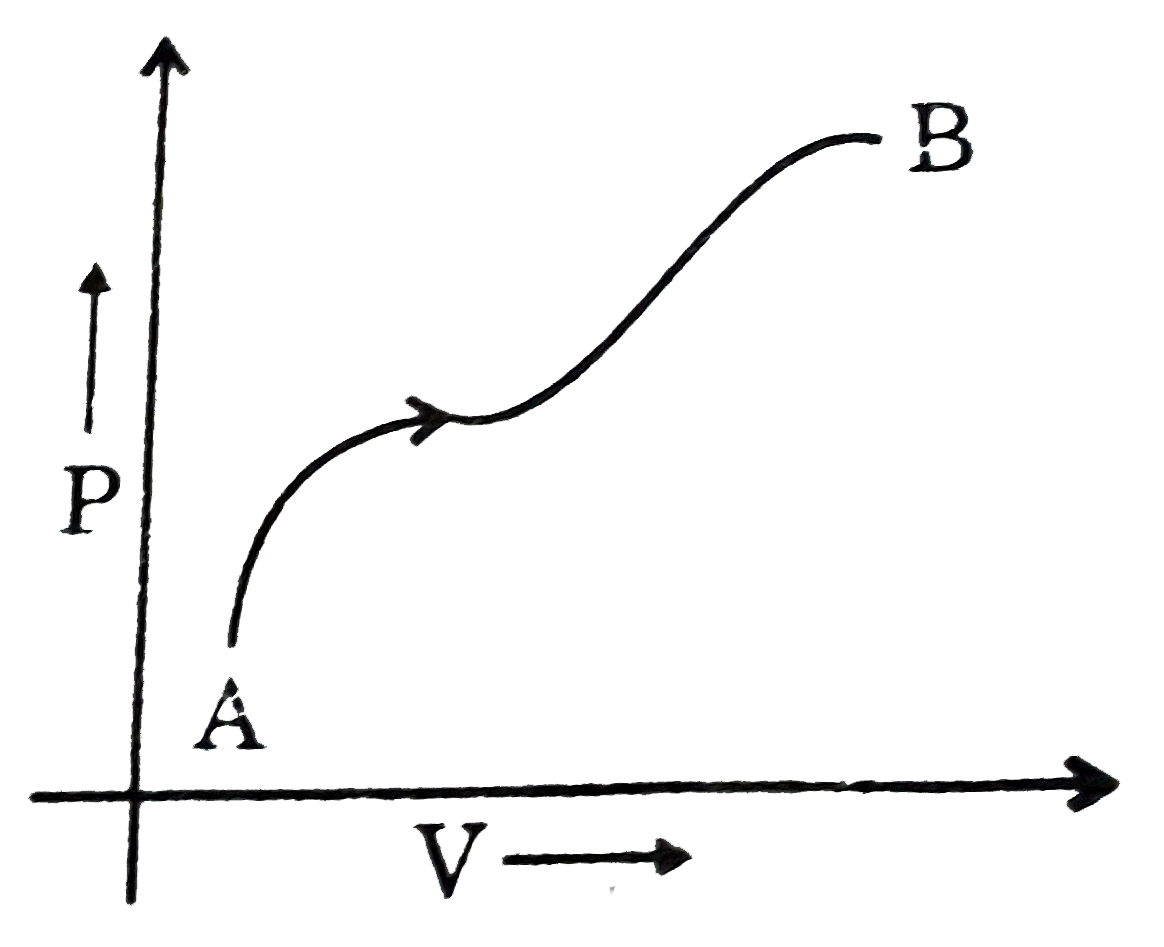
- The graph given below shows the P-V plot for a process on an ideal gas...
Text Solution
|
- The ratio of slopes of P-V plots for reversible adiabatic process and ...
Text Solution
|
- The P - V graph of an ideal gas cycle is shown here as below. The adia...
Text Solution
|
- The graph given below shows the P-V plot for a process on an ideal gas...
Text Solution
|
- The P-T graph, as given below, was observed for a process on an ideal ...
Text Solution
|
- The graph below shows V-p curve for three processes. Choose the correc...
Text Solution
|
- The P-T graph, as given below, was observed for a process on an ideal ...
Text Solution
|
- For the given P-V graph for an ideal gas, chose the correct V-T graph....
Text Solution
|
- Straight line on (p - T) graph for an ideal gas represents isochoric p...
Text Solution
|