


Similar Questions
Explore conceptually related problems
Recommended Questions
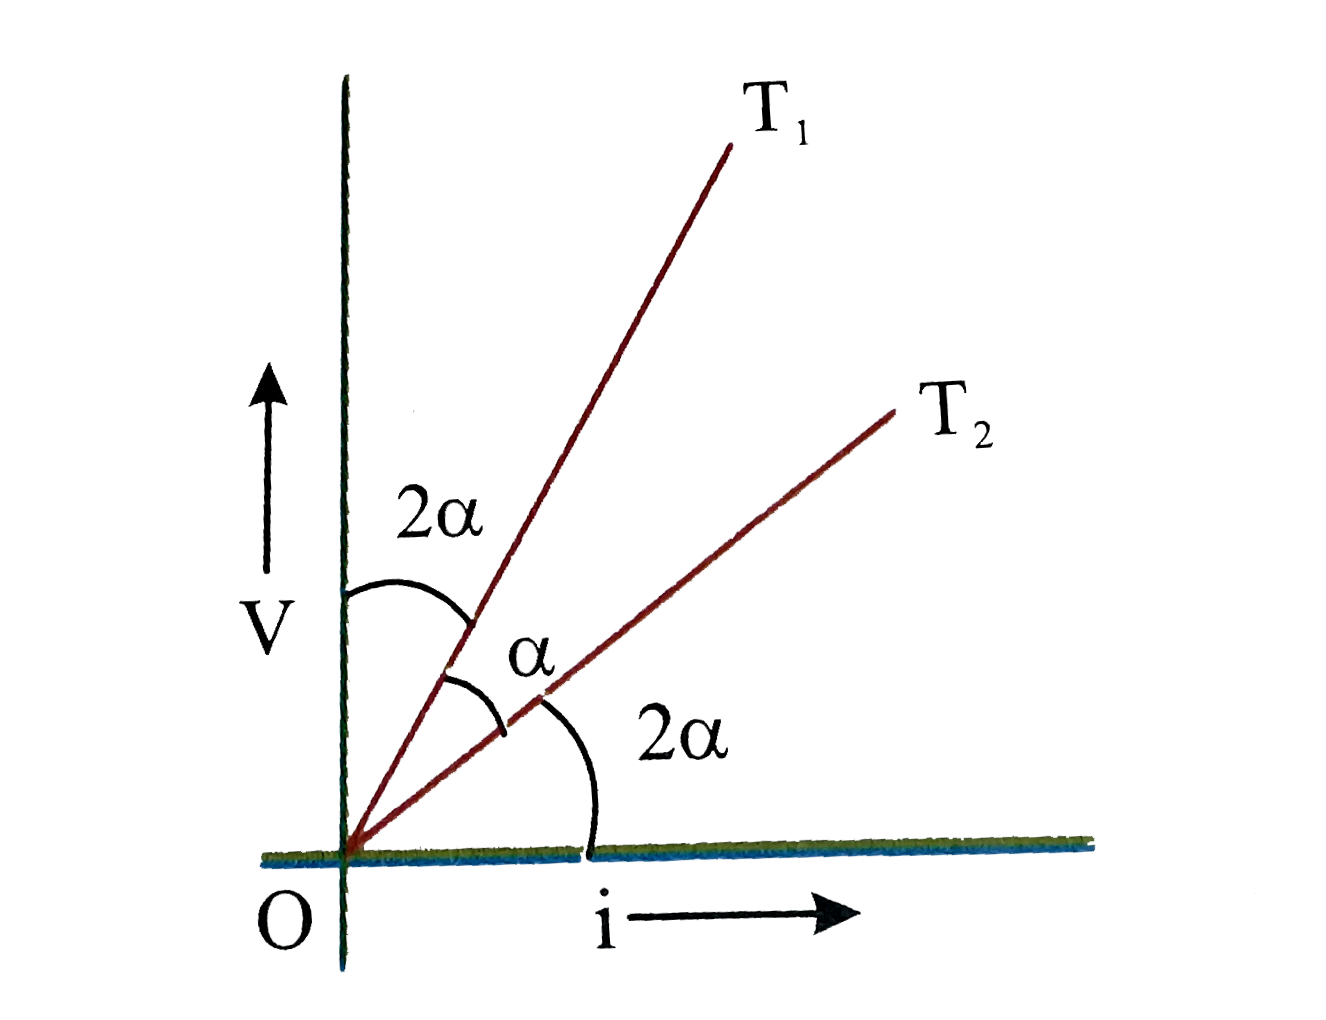
- The figure shows the variation of V with i at temperatures T(1) and T(...
Text Solution
|
- If the normals at points t1a n dt2 meet on the parabola, then t1t2=1 ...
Text Solution
|
- The figure shows the variation of V with i at temperatures T(1) and T(...
Text Solution
|
- The voltage V and current I graph for a conductor at two different tem...
Text Solution
|
- The V - i graph for a conductor at temperature T(1) and T(2) are as sh...
Text Solution
|
- The V-l graph for a conductor at temperatures T(1) " and " T(2) are as...
Text Solution
|
- For any arbitrary motion in space, which of the following relations ar...
Text Solution
|
- The voltage V and current I v graphs for a conductor at two different ...
Text Solution
|
- एकविमीय गति में किसी कण का वेग-समय ग्राफ चित्र 3.29 में दिखाया गया है ...
Text Solution
|