


Similar Questions
Explore conceptually related problems
Recommended Questions
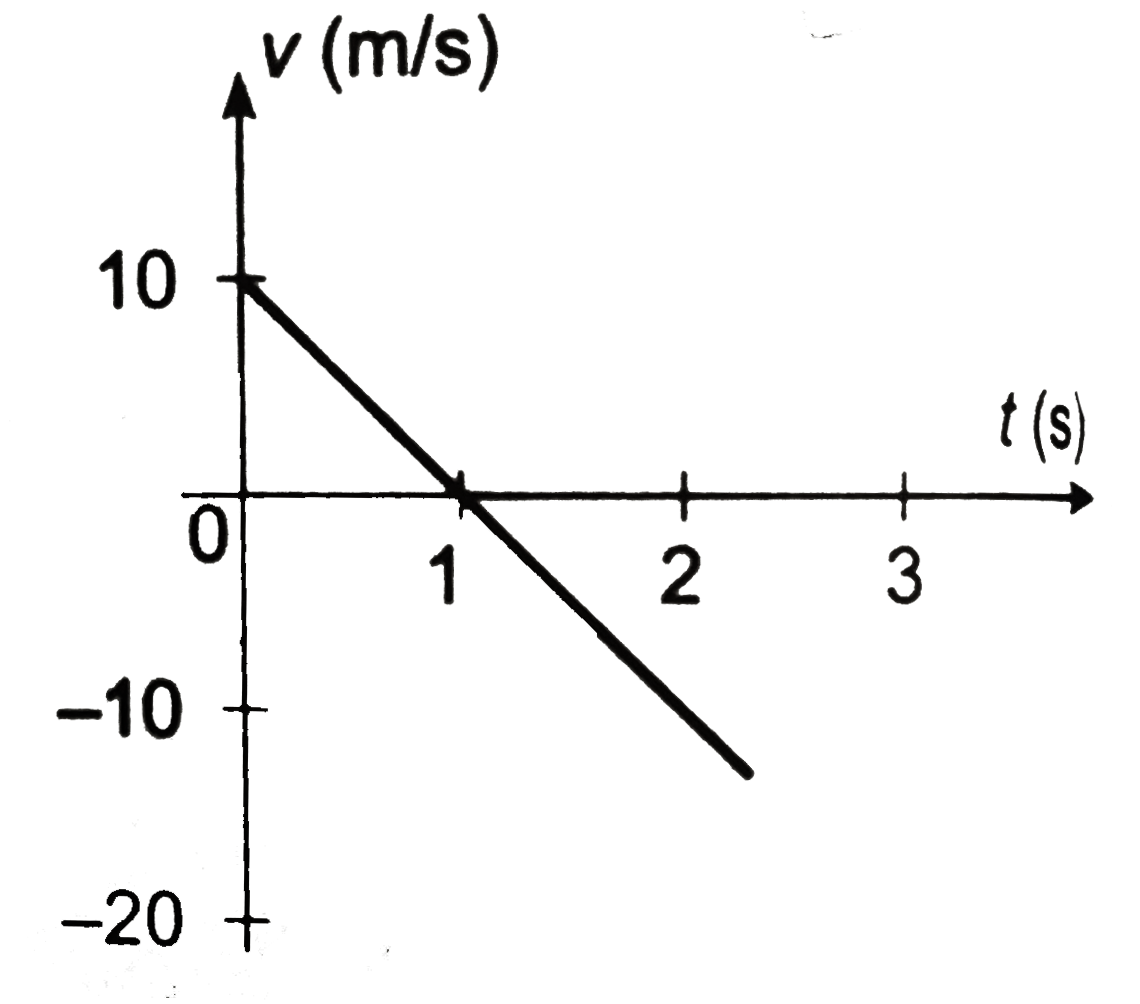
- The figure shows velocity-time graph of a particle moving along a stra...
Text Solution
|
- The figure shows velocity-time graph of a particle moving along a stra...
Text Solution
|
- Figure shows the acceleration-time graph of a particle moving along a ...
Text Solution
|
- The figure shows a velocity-time graph of a particle moving along a st...
Text Solution
|
- The figure shows a velocity-time graph of a particle moving along a st...
Text Solution
|
- The figure shows a velocity-time graph of a particle moving along a st...
Text Solution
|
- A particle starts to move along a straight line. The acceleration vers...
Text Solution
|
- Figure shows velocity time graph of a particle moving in straight line...
Text Solution
|
- The figure shows a velocity-time graph of a particle moving along a st...
Text Solution
|