


Similar Questions
Explore conceptually related problems
Recommended Questions
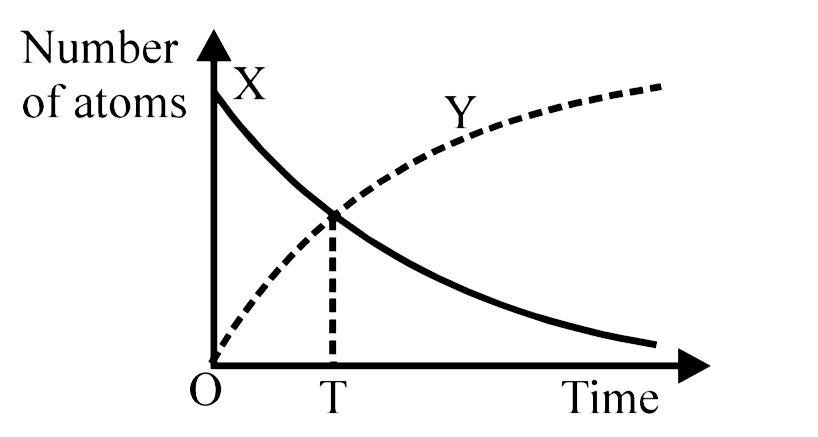
- The graph represents the decay of a newly-prepared sample of radioacti...
Text Solution
|
- A newly prepared radioactive nuclide has a decay constant lambda of 10...
Text Solution
|
- Samples of two radioactive nuclides, X and Y, each have equal activity...
Text Solution
|
- Radioactive element decays to form a stable nuclide, then the rate of ...
Text Solution
|
- The rate of decay (R ) of nuclei in a radioactive sample is plotted ag...
Text Solution
|
- The graph represents the decay of a newly-prepared sample of radioacti...
Text Solution
|
- A radioactive element X with half life 2 h decays giving a stable elem...
Text Solution
|
- The half life of 2g sample of radioactive nuclide 'X' is 15 min. The h...
Text Solution
|
- A radioactive element X with a half life of 2 hours decays giving a sa...
Text Solution
|