


Similar Questions
Explore conceptually related problems
Recommended Questions
- Following is the graph between (a-x) and time t for second order react...
Text Solution
|
- Following is the graph between (a-x) and time t for second order react...
Text Solution
|
- Half-life (t(1)) of the first order reaction and half-life (t(2)) of t...
Text Solution
|
- The rate of the first-order reaction X rarr products is 7.5 xx 10^(-4)...
Text Solution
|
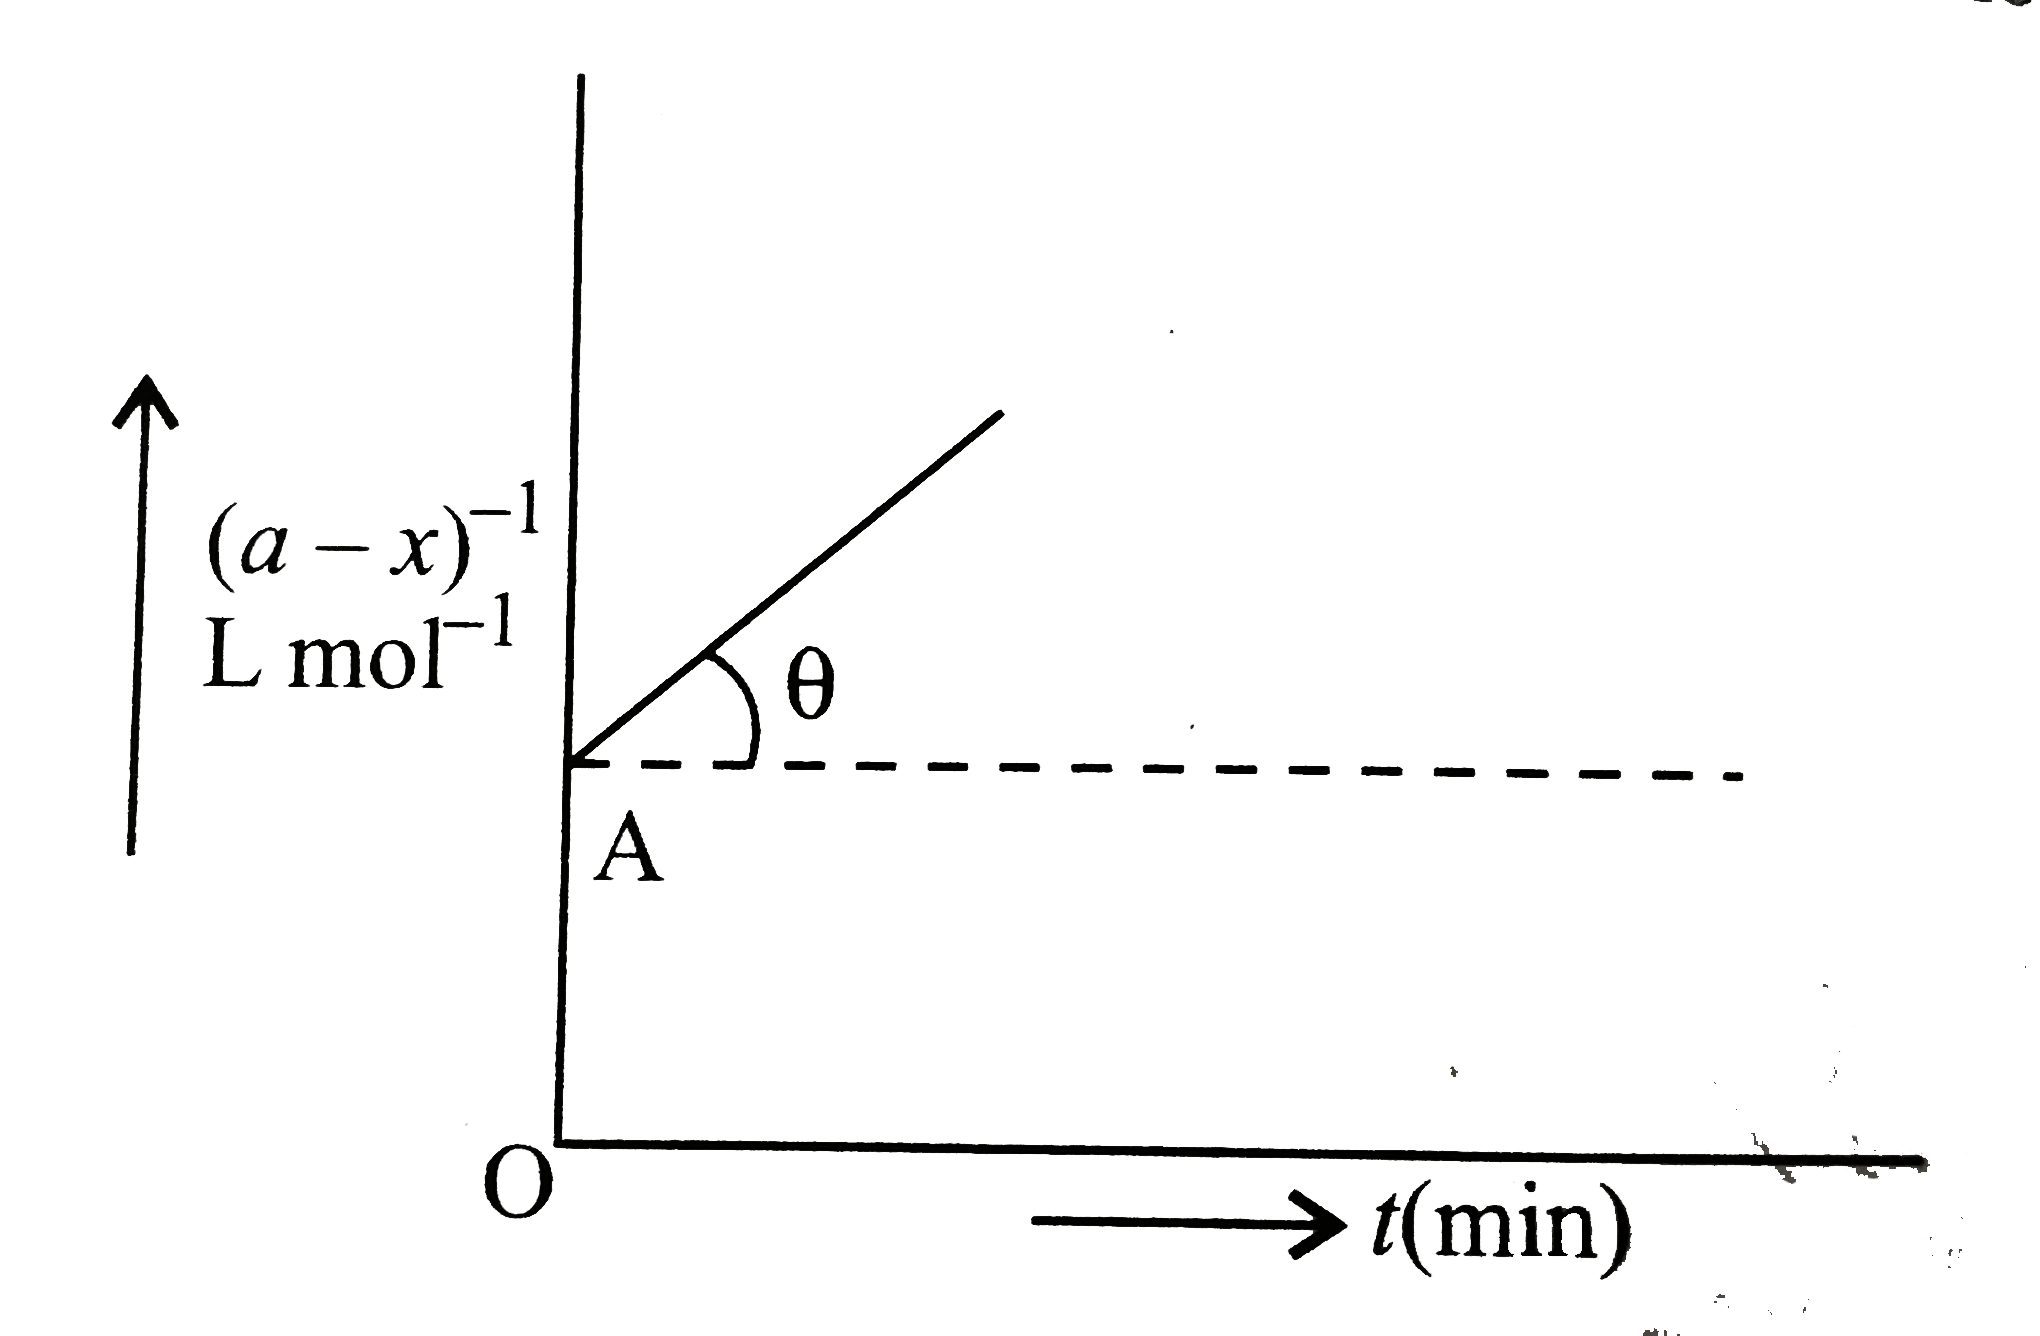
- Following is the graph between (a-x)^(-1) and time for second order re...
Text Solution
|
- Write units of rate constant for zero order and for the second order r...
Text Solution
|
- The rate of a first order reaction is 1.5 xx 10^(-2) mol L^(-1) "min"^...
Text Solution
|
- Which among the following plots are linear (a -x) is the concentration...
Text Solution
|
- In a zero order reaction, A to Products, starting with 0.5 mol L^(-1) ...
Text Solution
|