A
B
C
D
Text Solution
Verified by Experts
The correct Answer is:


Topper's Solved these Questions
Similar Questions
Explore conceptually related problems
JEE MAINS PREVIOUS YEAR-JEE MAIN-All Questions
- When proton of KE = 1.0 MeV moving in South to North direction enters ...
Text Solution
|
- Boolem relation at the output stage-Y FIGUREor the FIGUREollowng circu...
Text Solution
|
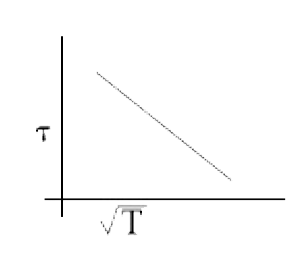
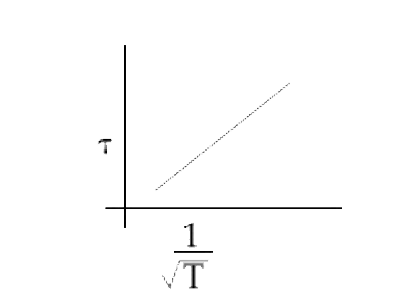
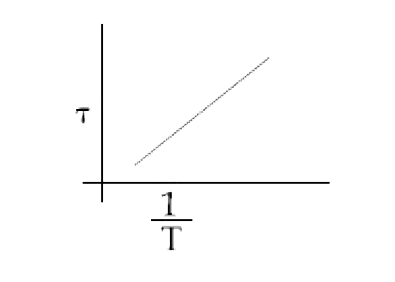
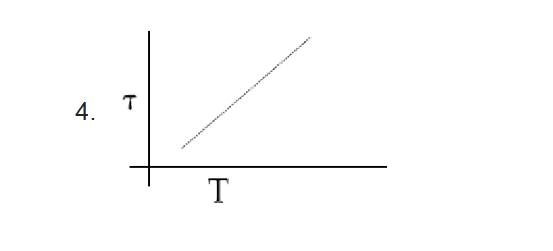
- Which graph correctly represents variation between relaxation time (t)...
Text Solution
|
- Two photons of energy 4eV and 4.5 eV incident on two metals A and B re...
Text Solution
|
- If relative permittivity and relative permeability of a medium are 3 a...
Text Solution
|
- A cylinder of height 1m is floating in water at 0^@C with 20cm height ...
Text Solution
|
- A thermodynamic cycle xyzx is shown on a V-T diagram. The P-V di...
Text Solution
|
- A telescope has magnification 5 and length of tube 60cm then the focal...
Text Solution
|
- A particles of mass m is fixed to one end of a light spring of force c...
Text Solution
|
- The dimension oFIGURE stooping potential V(0) in photoelectric eFIGURE...
Text Solution
|
- In FIGUREinding the electric FIGUREield using Gauses law the FIGUREorm...
Text Solution
|
- 3 charges are placed in a circle of radius d as shown in figure. Find ...
Text Solution
|
- There is a potentiometer wire of length 1200 cm and 60 mA current is f...
Text Solution
|
- At time t=0 magnetic FIGUREield oFIGURE 1000 Gauses is passing perpend...
Text Solution
|
- Consider a solid sphere oFIGURE radius R and mass density rho(r)=rho(0...
Text Solution
|
- EFIGUREFIGUREective capacitance oFIGURE parallel combination oFIGURE t...
Text Solution
|
- Consider two solid sphere oFIGURE radii R(1)=1m, R(2)=2m and masses M(...
Text Solution
|
- Consider the uniFIGUREorm rod oFIGURE mass M=4m and length l pivoted a...
Text Solution
|
- An open organ pipe of length 1m contains a gas whose density is twice ...
Text Solution
|
- A point object in air is in FIGUREront oFIGURE the curved surFIGUREace...
Text Solution
|