


Similar Questions
Explore conceptually related problems
Recommended Questions
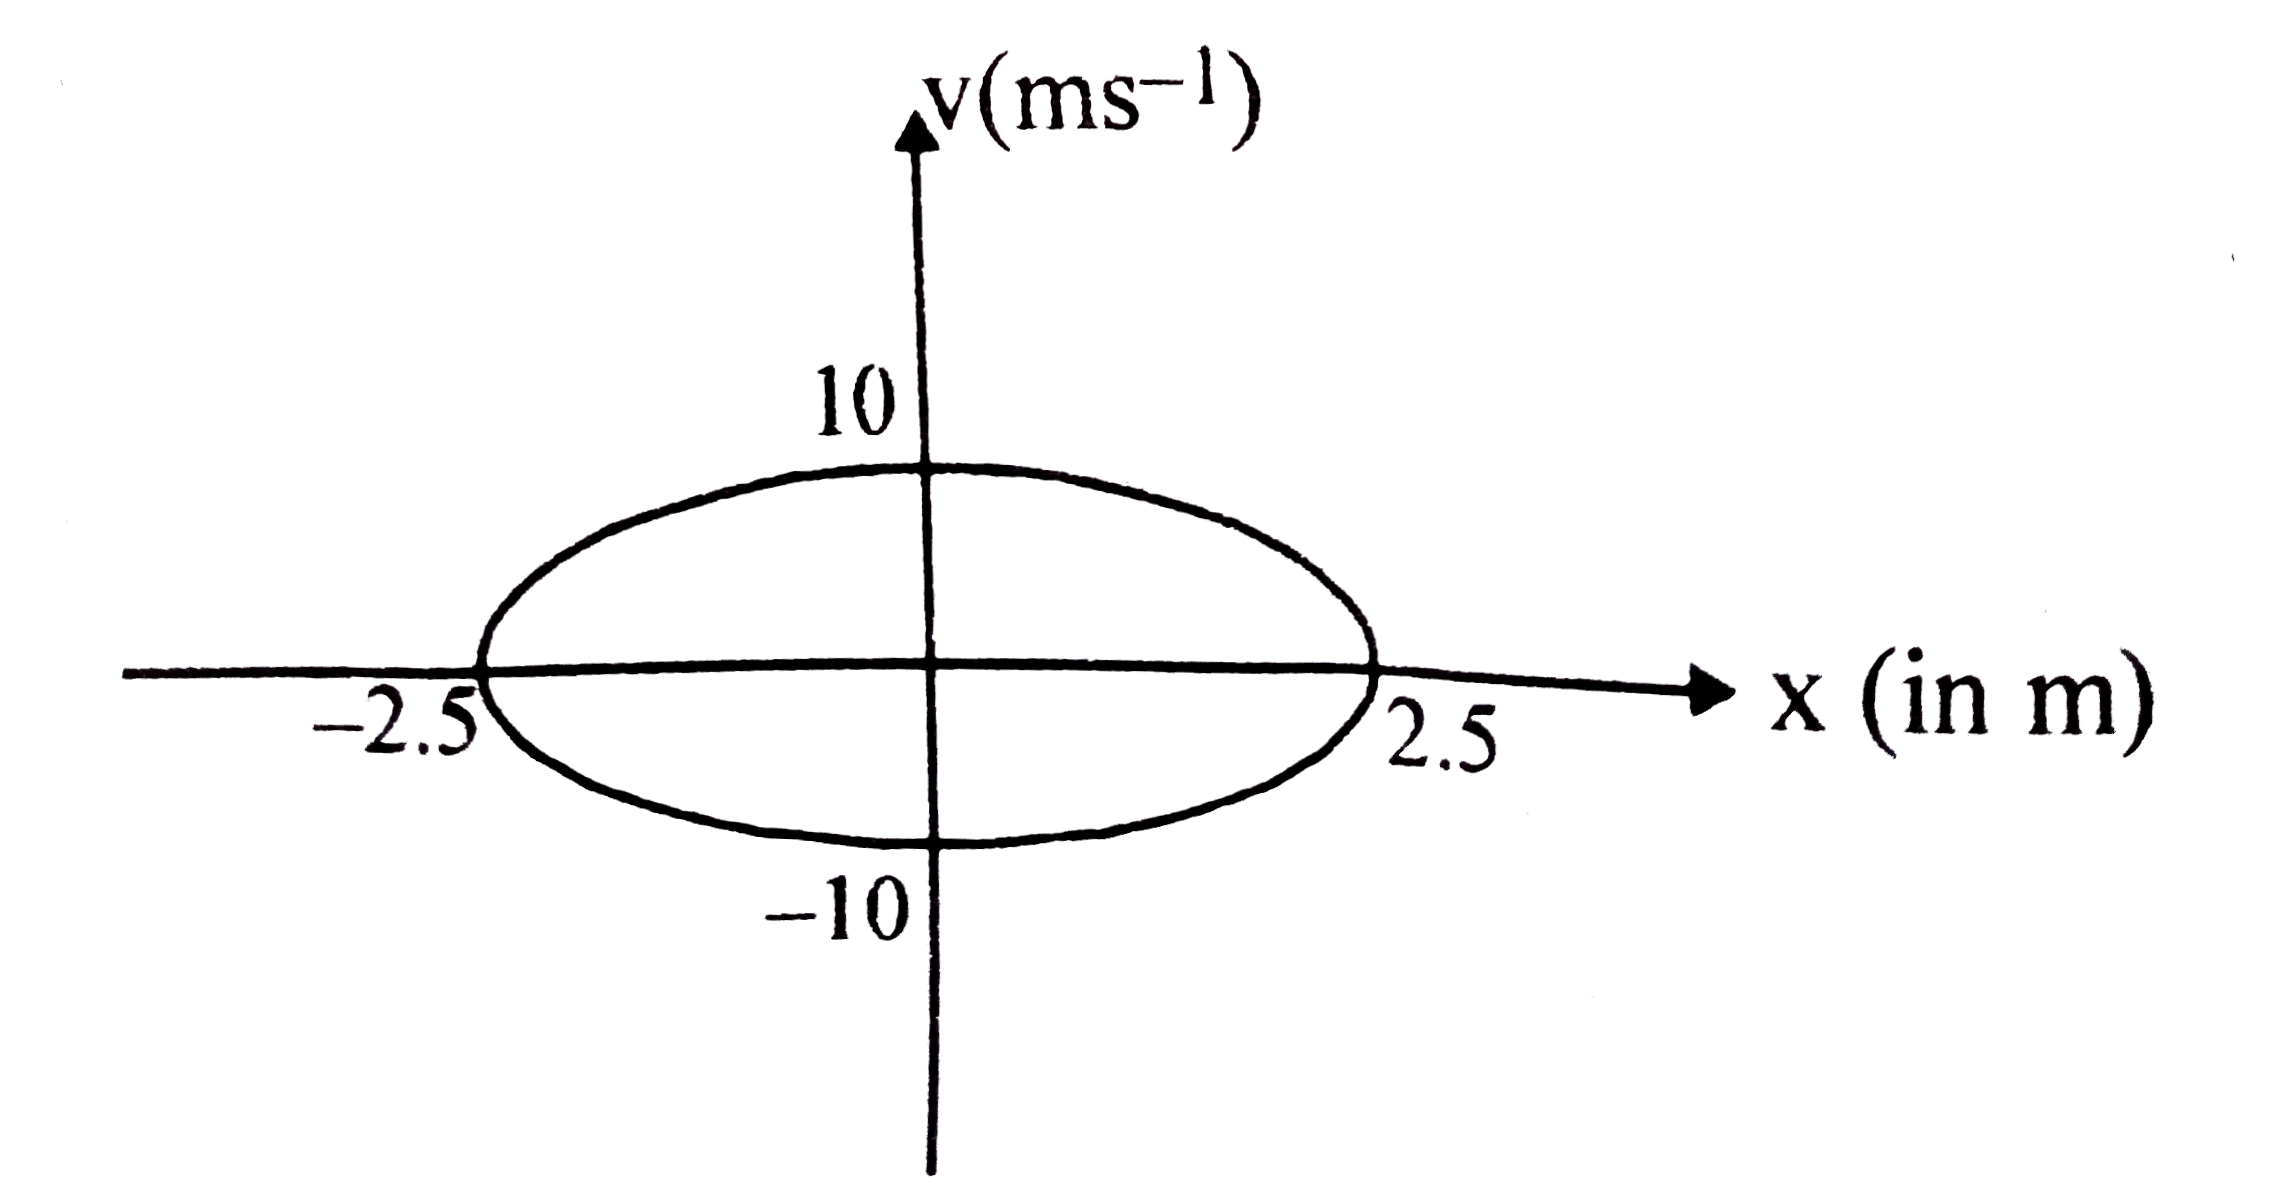
- The figure shows graph between velocity 'V' and displacement 'X' from ...
Text Solution
|
- The acceleration displacement graph of a particle executing simple har...
Text Solution
|
- The figure shows graph between velocity 'V' and displacement 'X' from ...
Text Solution
|
- The figure shows graph between velocity 'V' and displacement 'X' from ...
Text Solution
|
- Figure shows the graph of velocity versus displacement of a partciel e...
Text Solution
|
- The velocity of a particle in simple harmonic motion at displacement y...
Text Solution
|
- The plot of velocity (v) versus displacement (x) of a particle executi...
Text Solution
|
- सरल आवर्त गति करते हुए कण के वेग तथा त्वरण के व्यंजक कण के विस्थापन ...
Text Solution
|
- यदि किसी सरल आवर्त करते कण का मध्यमान स्थिति से विस्थापन x हो तो सरल ...
Text Solution
|