Home
Class 11
PHYSICS
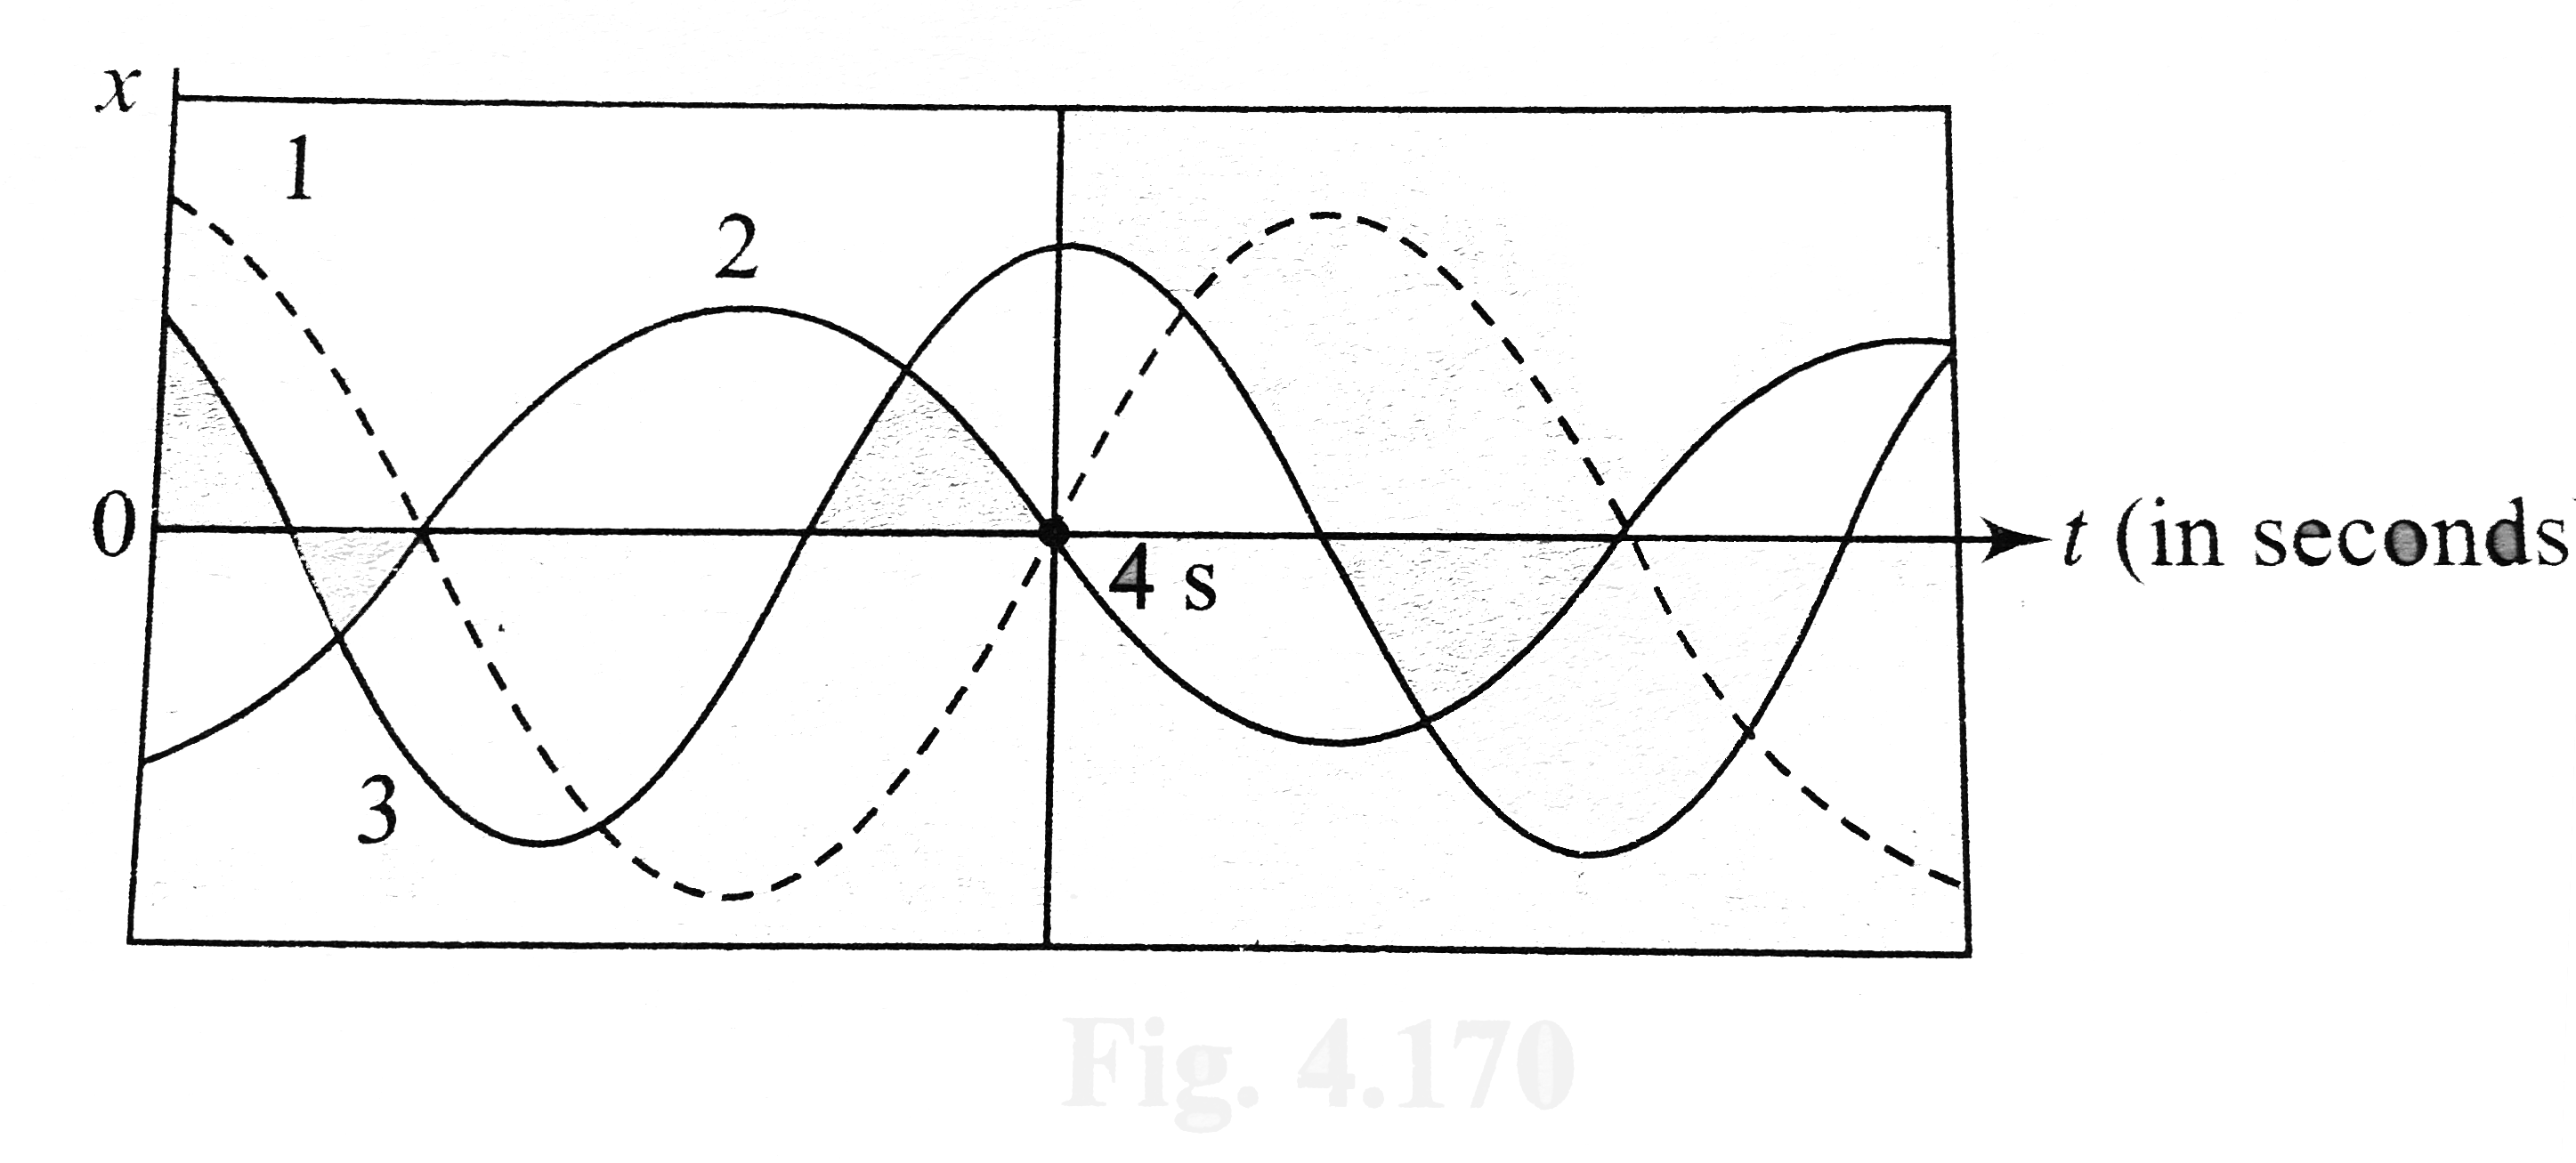
Graph shows the x(t) curves for the thre...


Graph shows the `x(t)` curves for the three experiments involving a particular spring block system oscillating in SHM. The kinetic energy of the system is maximum at `t=4` s. For the situation.

Promotional Banner

Similar Questions

Explore conceptually related problems

In S.H.M., the graph between kinetic energy K and time 't' is

Two blocks A and B each of mass m are connected by a massless spring of natural length L and spring constant k. The blocks are initially resting on a smooth horizontal floor with the spring at its natural length. A third identical block C also of mass m moves on the floor with a speed v along the line joining A and B and collides with A. Then The kinetic energy of the A-B system at maximum compression of the spring is mv^(2)//4 The maximum compression of the spring vsqrt(m//3k) The kinetic energy of the A-B system at maximum compression The maximum coppression of the spring is vsqrt(m//k)

A mass is suspended from the end of a spring. When the system is oscillating the amplitude of oscillation is 4 cm and maximum kinetic energy of oscillation of the system is 1J. Then the force constant of the spring is

While comparing the L-C oscillations with the oscillations of spring-block system, with whom the magnetic energy can be compared and why?

While comparing the L-C oscillations with the oscillations of spring-block system, with whom the magnetic energy can be compared and why?

A body performs S.H.M. Its kinetic energy K varies with time t as indicated by graph

A body performs S.H.M. Its kinetic energy K varies with time t as indicated by graph

In S.H.M., potential energy (U) V/s, time (t) . Graph is

In S.H.M., potential energy (U) V/s, time (t) . Graph is