


Similar Questions
Explore conceptually related problems
Recommended Questions
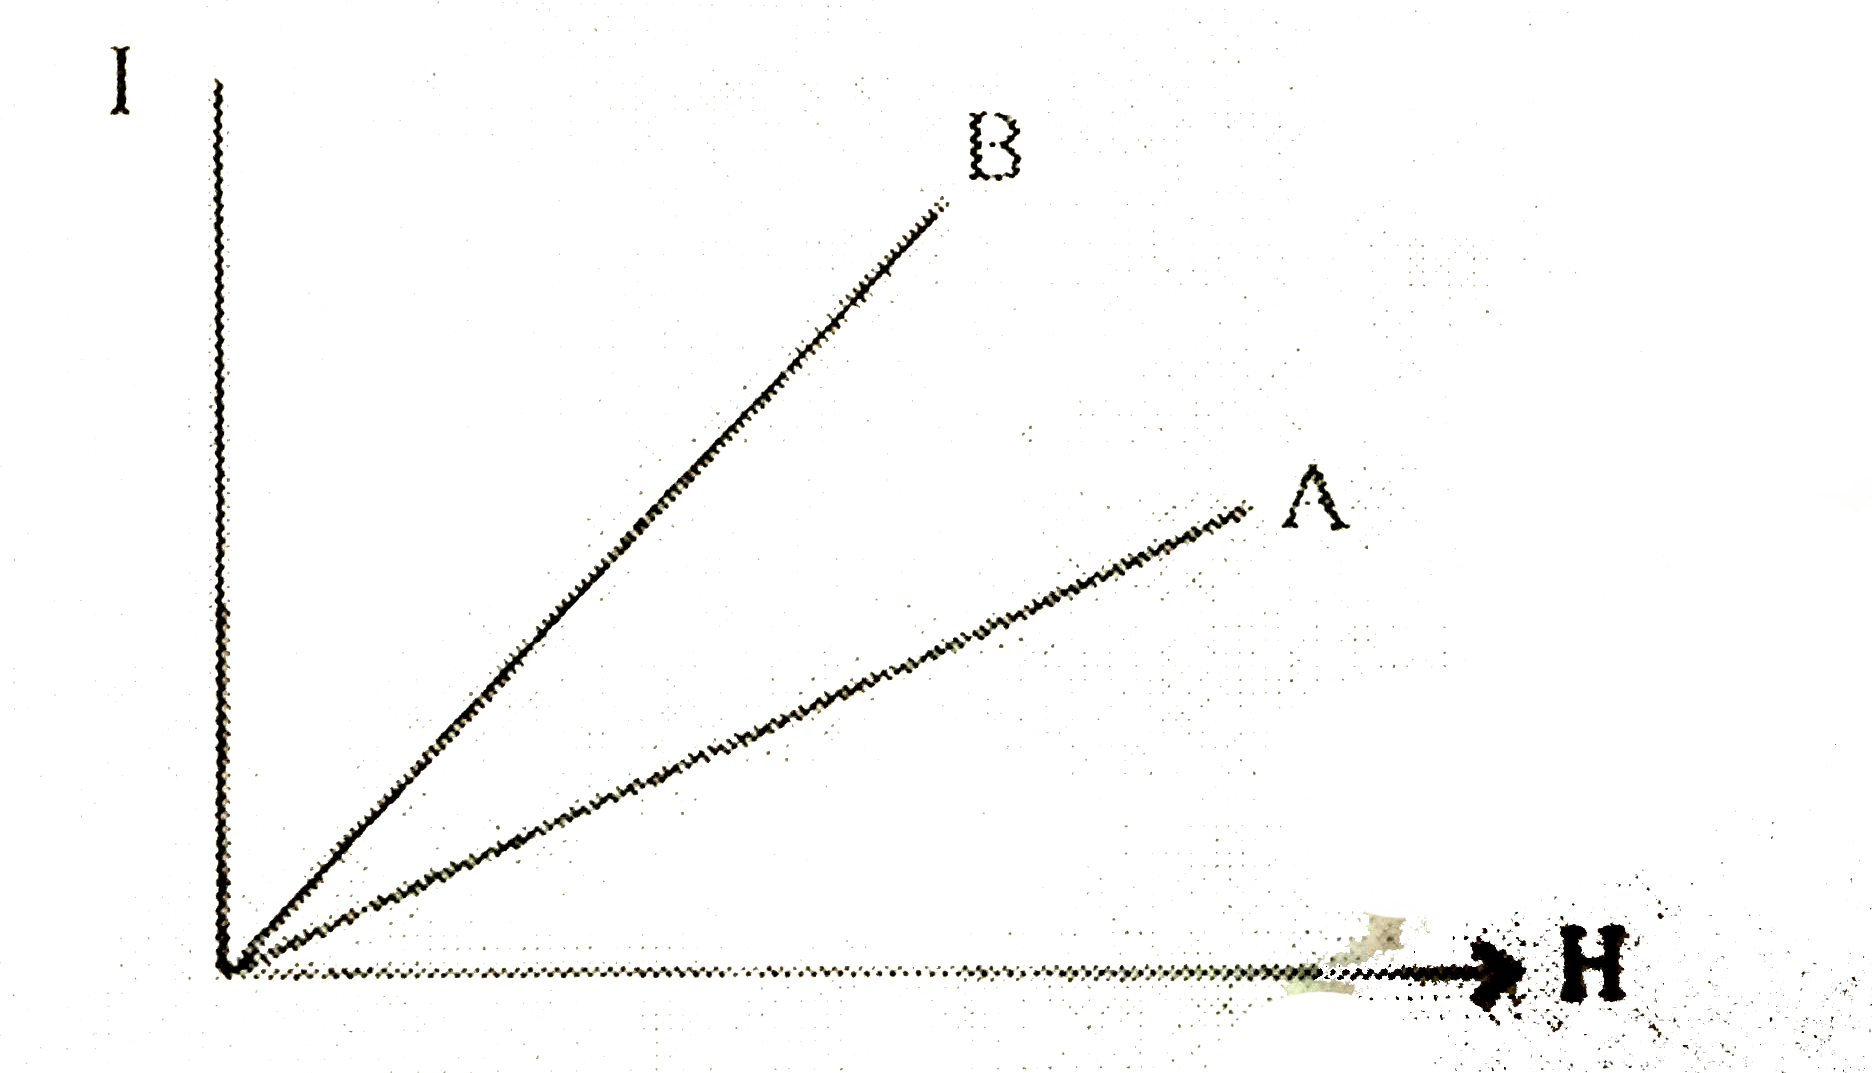
- The following figure shows the variation of intensity of magnetisat...
Text Solution
|
- The following figure shows the variation of intensity of magnetisation...
Text Solution
|
- The ratio of the magnetic field vec(B) at a point in a material to ...
Text Solution
|
- निम्न चित्र दो पदार्थों A और B के लिए चुंबकीय तीव्रता के विरुद्ध चुंबक...
Text Solution
|
- निम्न चित्र दो चुंबकीय पदार्थों A और B के लिए चुंबकीय तीव्रता H के विर...
Text Solution
|
- निम्न चित्र दो चुंबकीय पदार्थों A और B के लिए चुंबकीय तीव्रता H के विर...
Text Solution
|
- The following figure shows the variation of intensity of magnetisation...
Text Solution
|
- The magnetic induction and magnetising field intensity in a sample of ...
Text Solution
|
- The following figure shows the variation of intensity of magnetisation...
Text Solution
|