


Similar Questions
Explore conceptually related problems
Recommended Questions
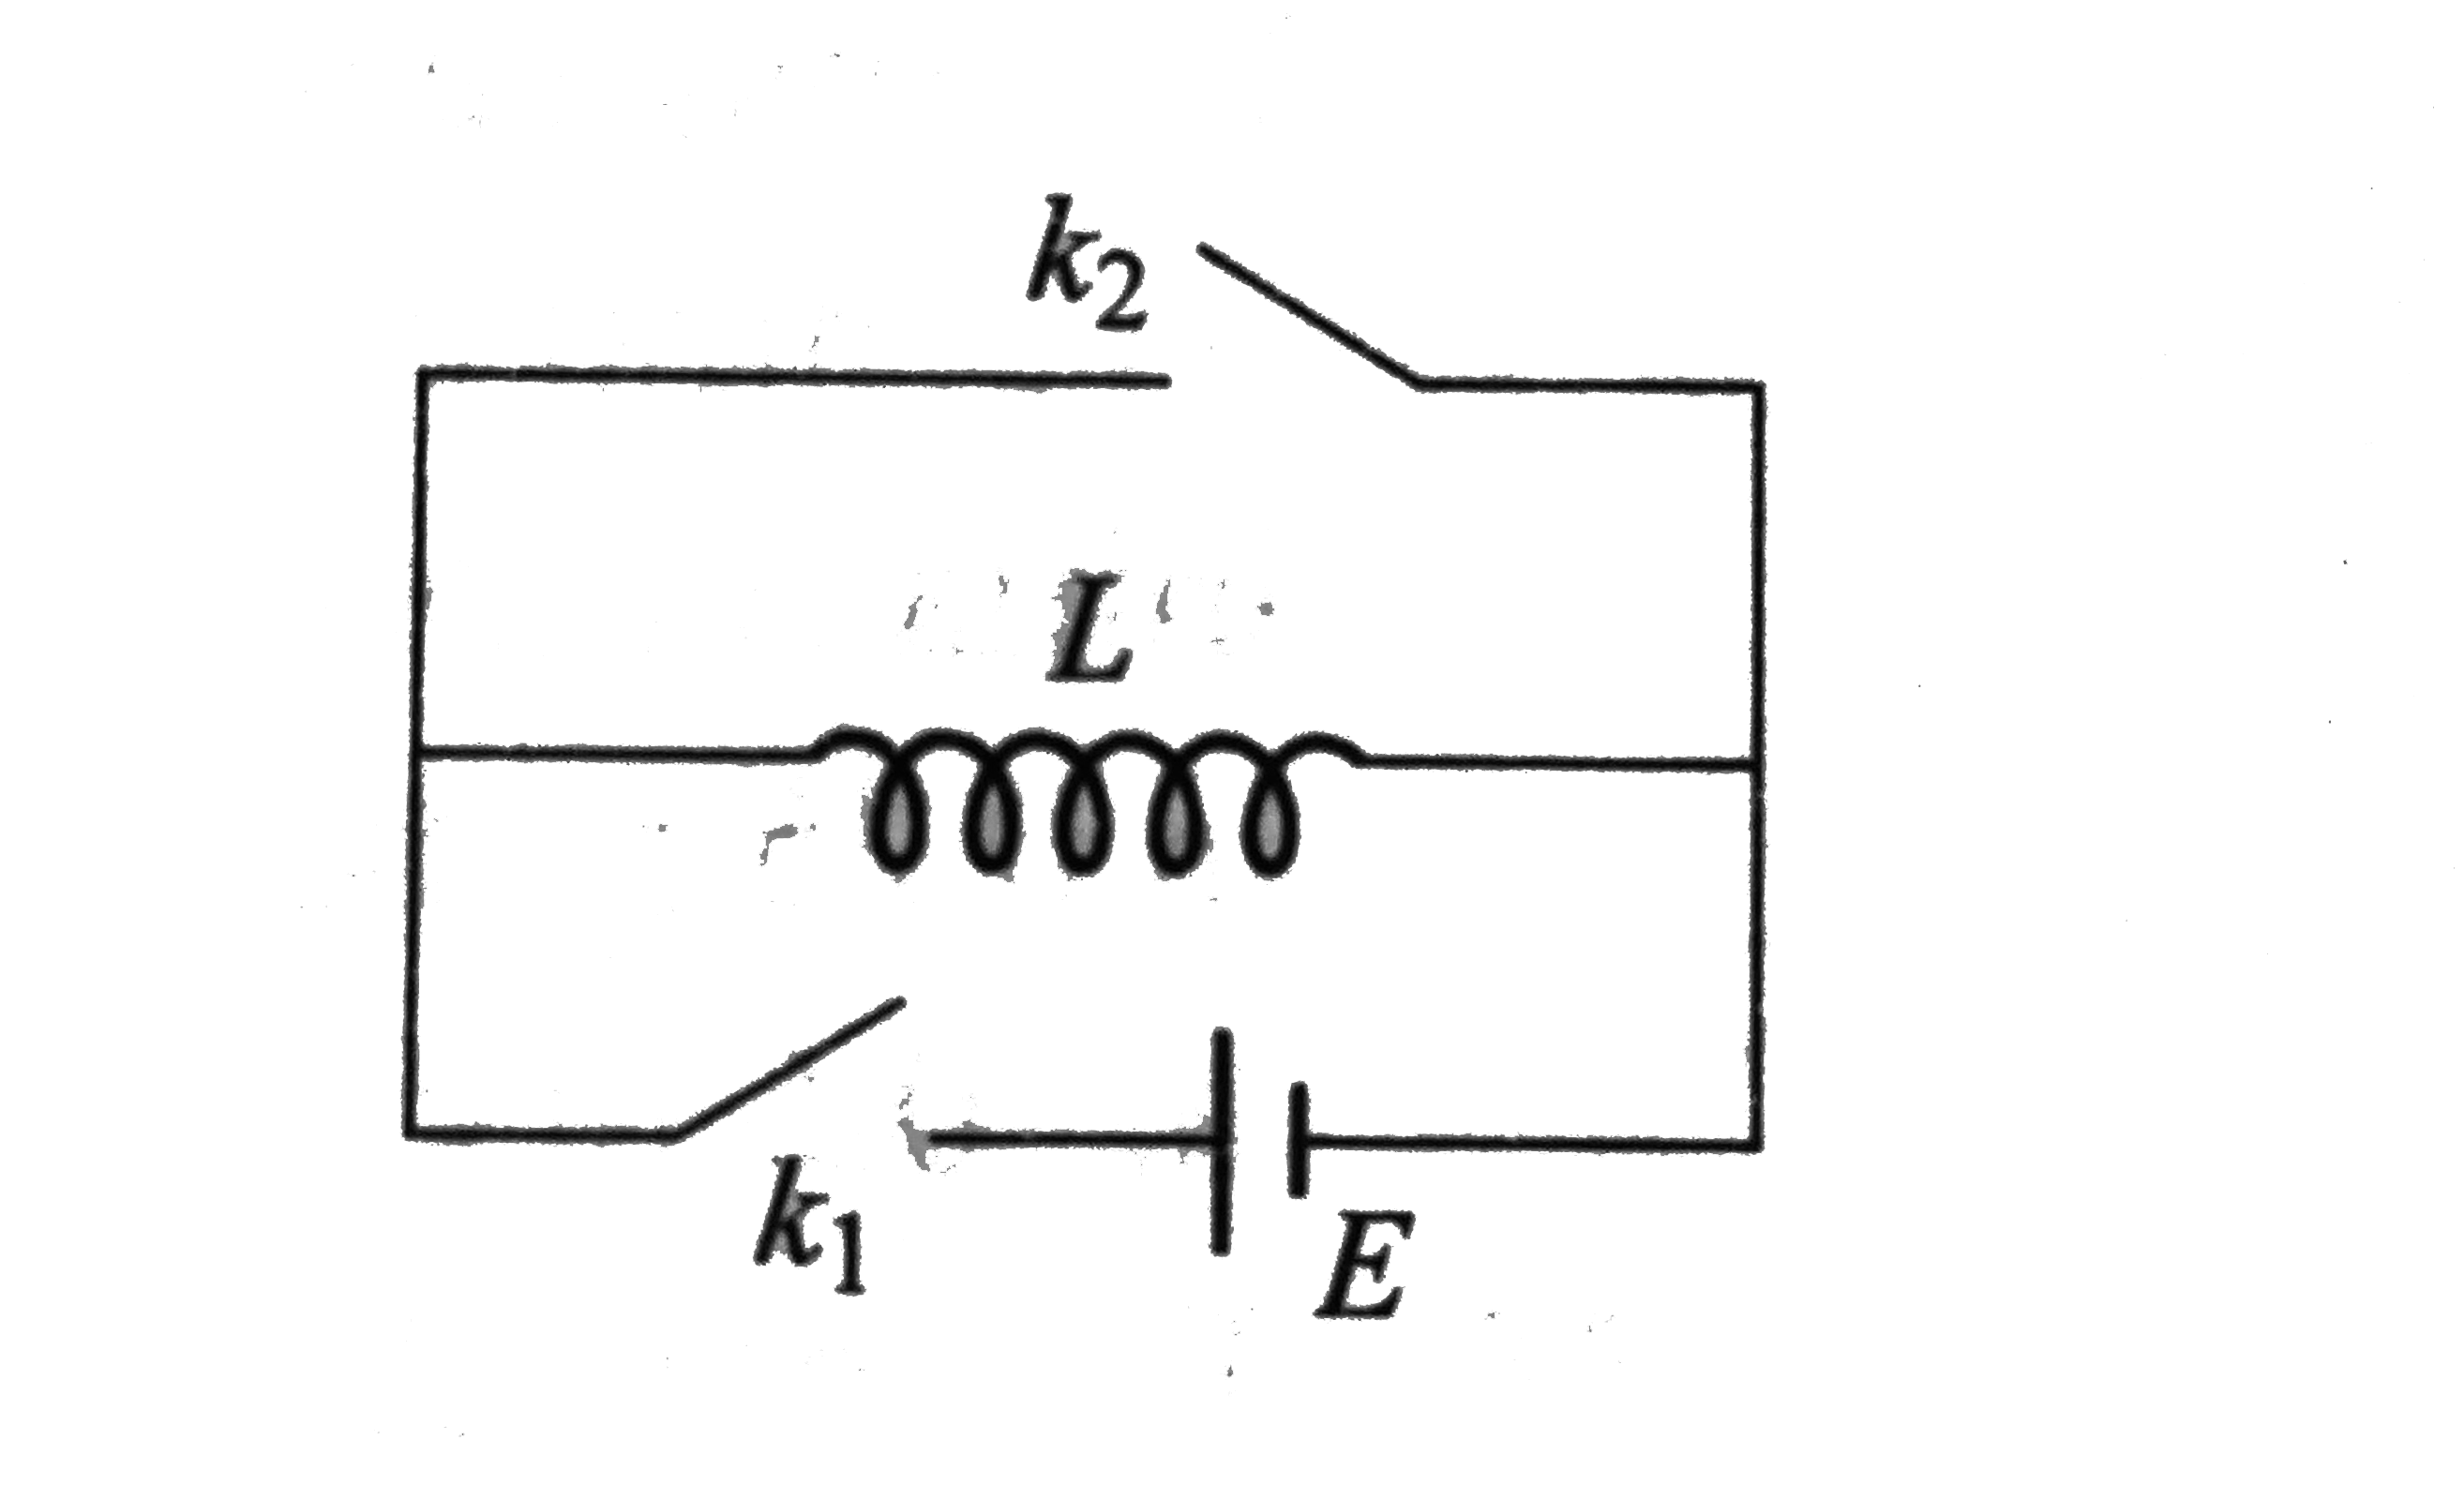
- In the circuit shows in Fig. switch k(2) is open and switch k(1) is cl...
Text Solution
|
- The switch in figure is closed at time t = 0 . Find the current in the...
Text Solution
|
- A circuit contains an ideal cell and an inductor with a switch. Initia...
Text Solution
|
- In Fig. switch S is closed for a long time. At t = 0 , if it is opened...
Text Solution
|
- In the circuit shows in Fig. switch k(2) is open and switch k(1) is cl...
Text Solution
|
- In the circuit shows in Fig the switch is closed at t = 0.
Text Solution
|
- In the circuit in Fig. switch S(1) was closed for a long time . At tim...
Text Solution
|
- In the circuit in Fig. switch S(1) was closed for a long time . At tim...
Text Solution
|
- A circuit containing two capacitor C(1) and C(2) shown in figure is in...
Text Solution
|