


Similar Questions
Explore conceptually related problems
Recommended Questions
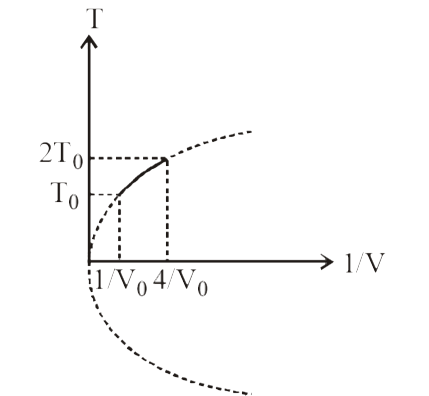
- Figure shows a parabolic graph between T and 1/V for a mixture of a ga...
Text Solution
|
- Find the ratio of the mean speed of hydrogen molecules to the mean spe...
Text Solution
|
- A mixture of gases contains H(2) and O(2) gases in the ratio of 1:4 (w...
Text Solution
|
- Figure shows a parabolic graph between T and 1/V for a mixture of a ga...
Text Solution
|
- The figure shows the graph of logarithmic reading of pressure and volu...
Text Solution
|
- The figure shows the graph of logarithmic reading of pressure and volu...
Text Solution
|
- Figure shows a parabolic graph between T and (1)/(V) (T = temperature,...
Text Solution
|
- If v(rms) is the rms speed of molecules in a gas and v is the speed of...
Text Solution
|
- A mixture of gases contain H(2) and O(2) gases in the ratio of 1 : 4 (...
Text Solution
|