


Similar Questions
Explore conceptually related problems
Recommended Questions
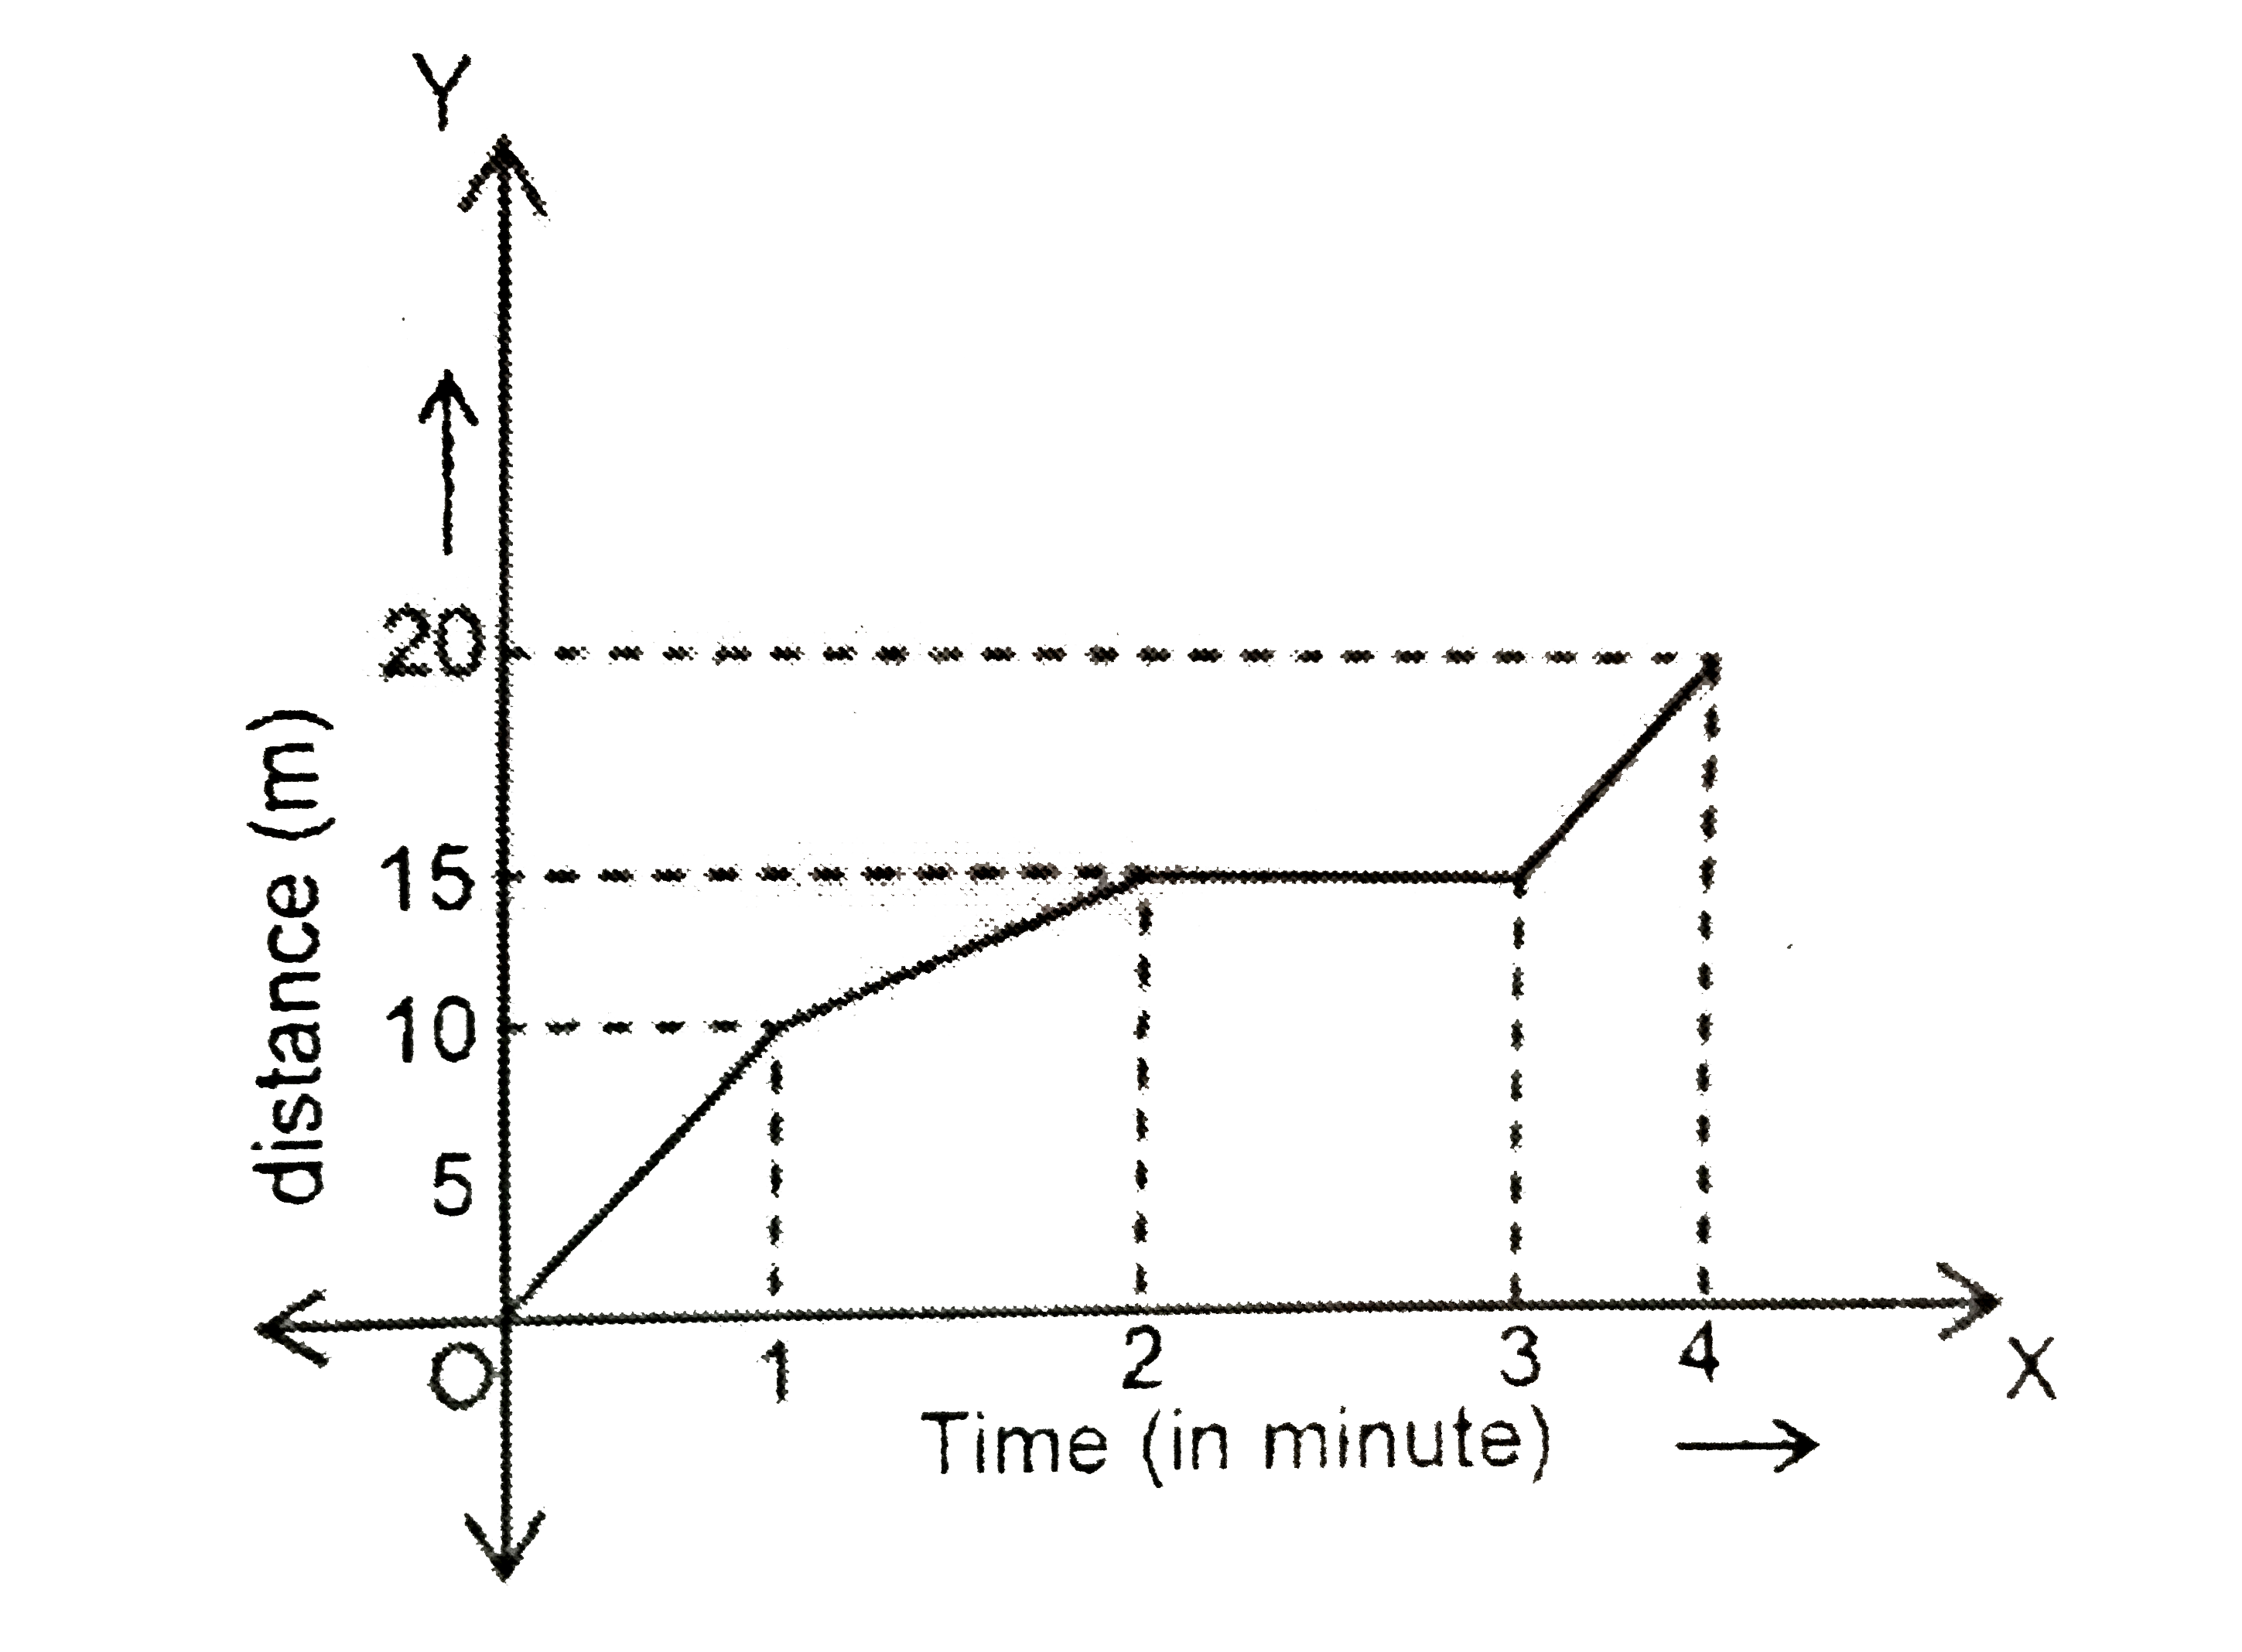
- Distance versus time graph of an object is as shown in the figure. The...
Text Solution
|
- Distance versus time graph of an object is as shown in the figure. The...
Text Solution
|
- चित्र में किसी वस्तु के लिए त्वरण-समय ग्राफ प्रदर्शित किया गया है। इसी...
Text Solution
|
- If the distance-time graph of an object is a curved line, then the spe...
Text Solution
|
- किसी वस्तु के लिये त्वरण-समय ग्राफ चित्र में दिखाया गया है। तो संगत वे...
Text Solution
|
- एकसमान चाल से गतिशील वस्तु का दूरी-समय ग्राफ होता है-
Text Solution
|
- Figure shows distance - time graphs of two objects A and B . Which obj...
Text Solution
|
- Given below as Figure 13.8 is the distance-time graph of the motion an...
Text Solution
|
- Distance versus time graph of an object is as shown in the figure. The...
Text Solution
|