


Similar Questions
Explore conceptually related problems
Recommended Questions
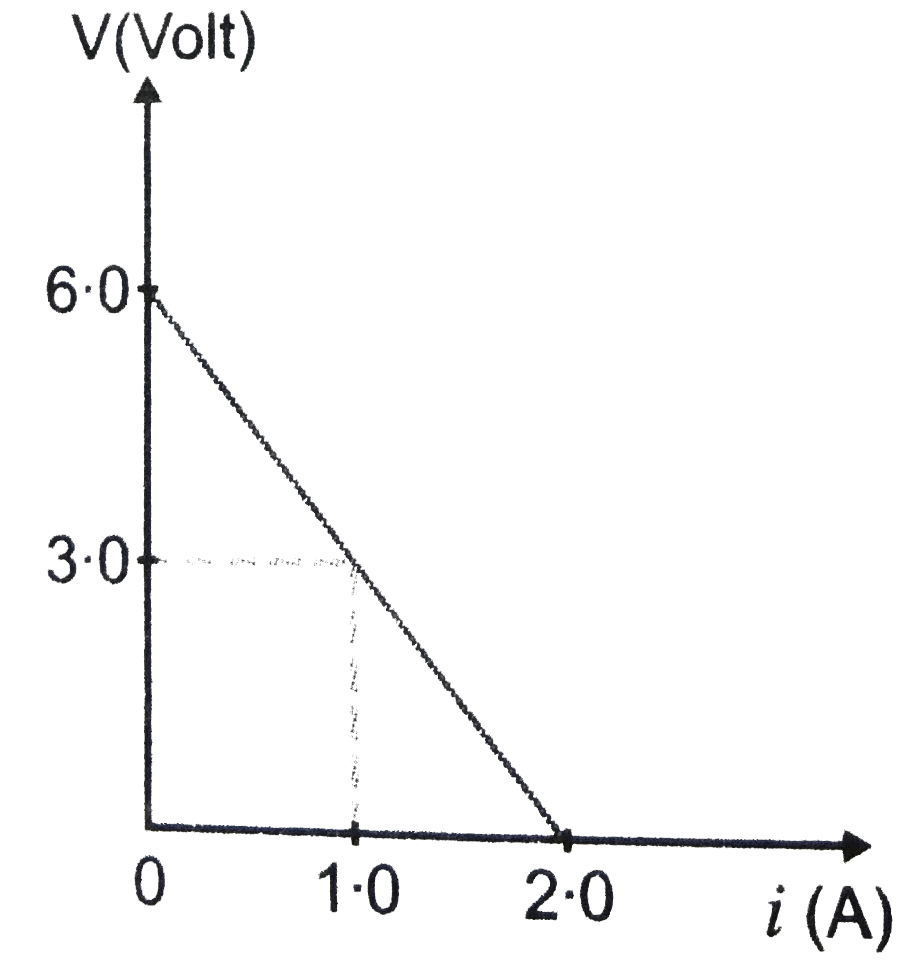
- The following graph shows the variation of terminal potential differen...
Text Solution
|
- Draw a. current versus load and b. current versus potential difference...
Text Solution
|
- The plot of the variation of potential difference across a combination...
Text Solution
|
- A cell of emf epsilon and internal resistance r is connected across a ...
Text Solution
|
- The following graph shows the variation of terminal potential differen...
Text Solution
|
- (a) Find the potential difference between A and B (b) Calculate t...
Text Solution
|
- Calculate (i) current in the 6Omega resistor, (ii) terminal voltage ac...
Text Solution
|
- A cell of emf E and internal resistance r is connected across a variab...
Text Solution
|
- .A cell of emf E and internal resistance r is connected across a varia...
Text Solution
|