


Similar Questions
Explore conceptually related problems
Recommended Questions
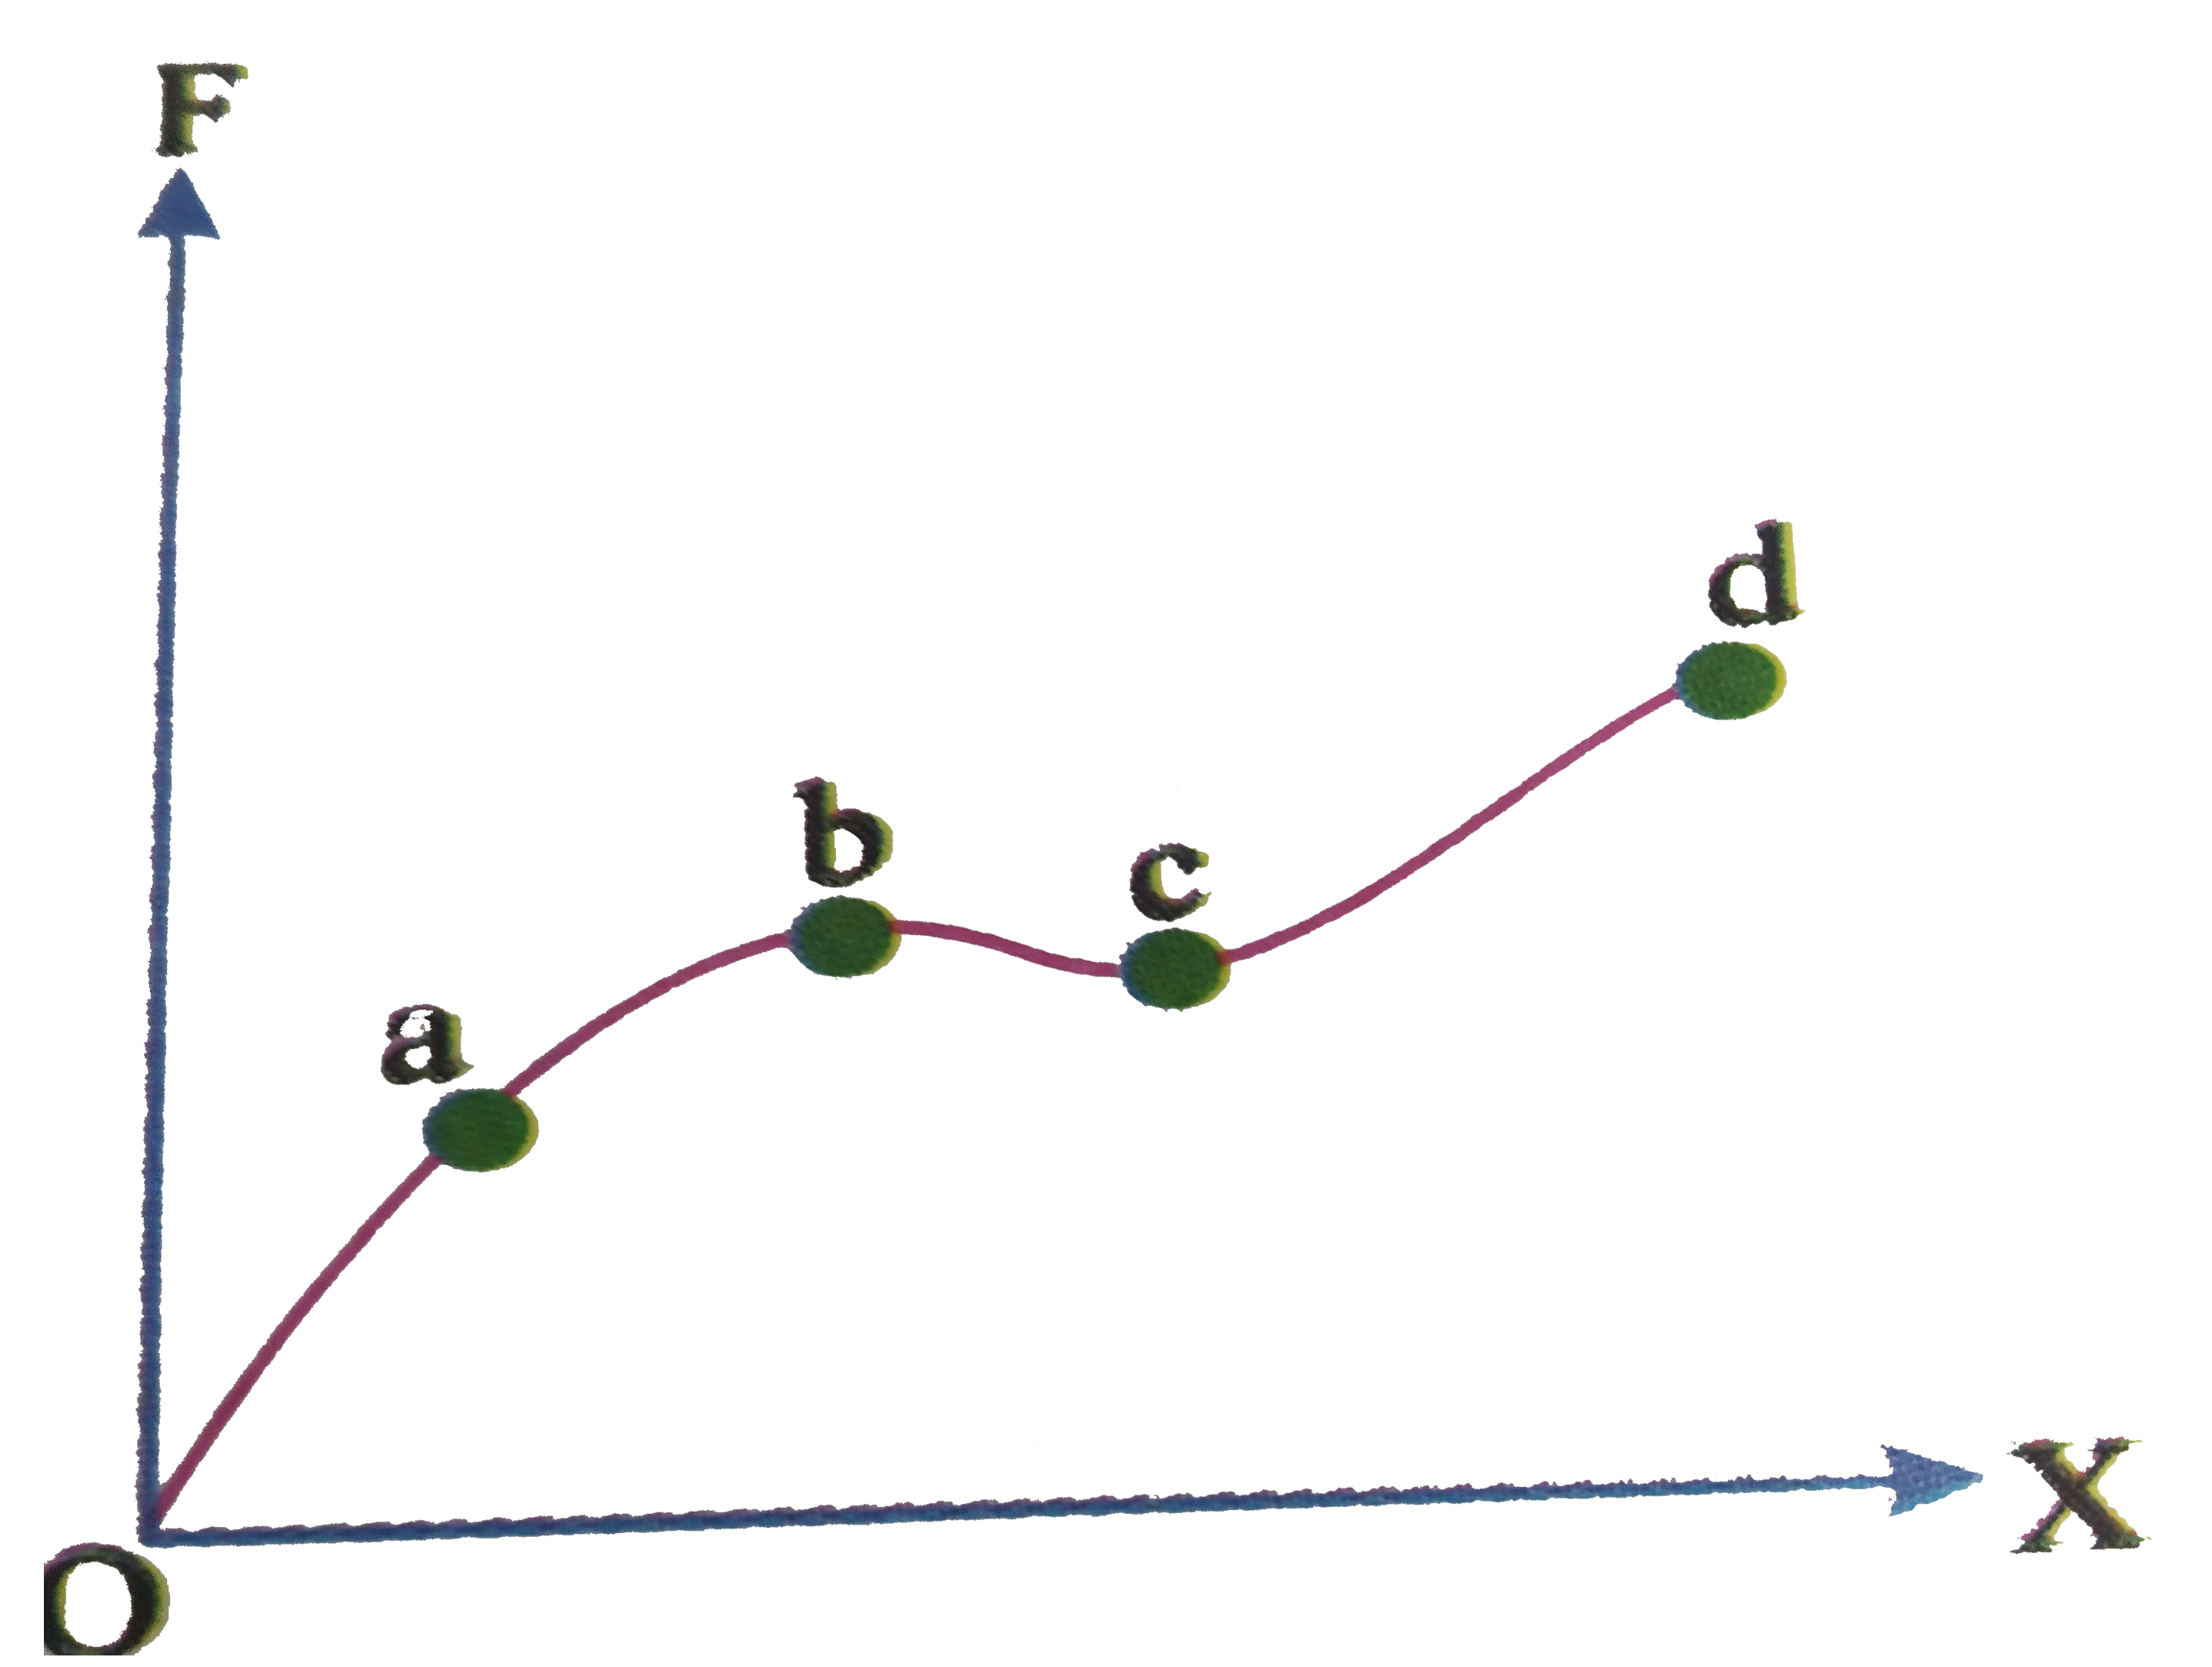
- The diagram represents the applied force per unit area (F) with the...
Text Solution
|
- Two wires are made of the same material and have the same volume. Howe...
Text Solution
|
- Braking froce per unit area of cross section of a wire is called
Text Solution
|
- The diagram represents the applied force per unit area (F) with the st...
Text Solution
|
- The specific resistance per unit area of cross section of a wire is eq...
Text Solution
|
- Two wires are made of the same material and have the same volume. The ...
Text Solution
|
- निम्नांकित वक्र एकांक क्षेत्रफल पर लगाए गए बल (F) तथा विकृति (X) पतले ...
Text Solution
|
- Two wires are made of the same material and have the same volume. Howe...
Text Solution
|
- The graph is drawn between the applied force F and the strain (X) for ...
Text Solution
|