


Similar Questions
Explore conceptually related problems
Recommended Questions
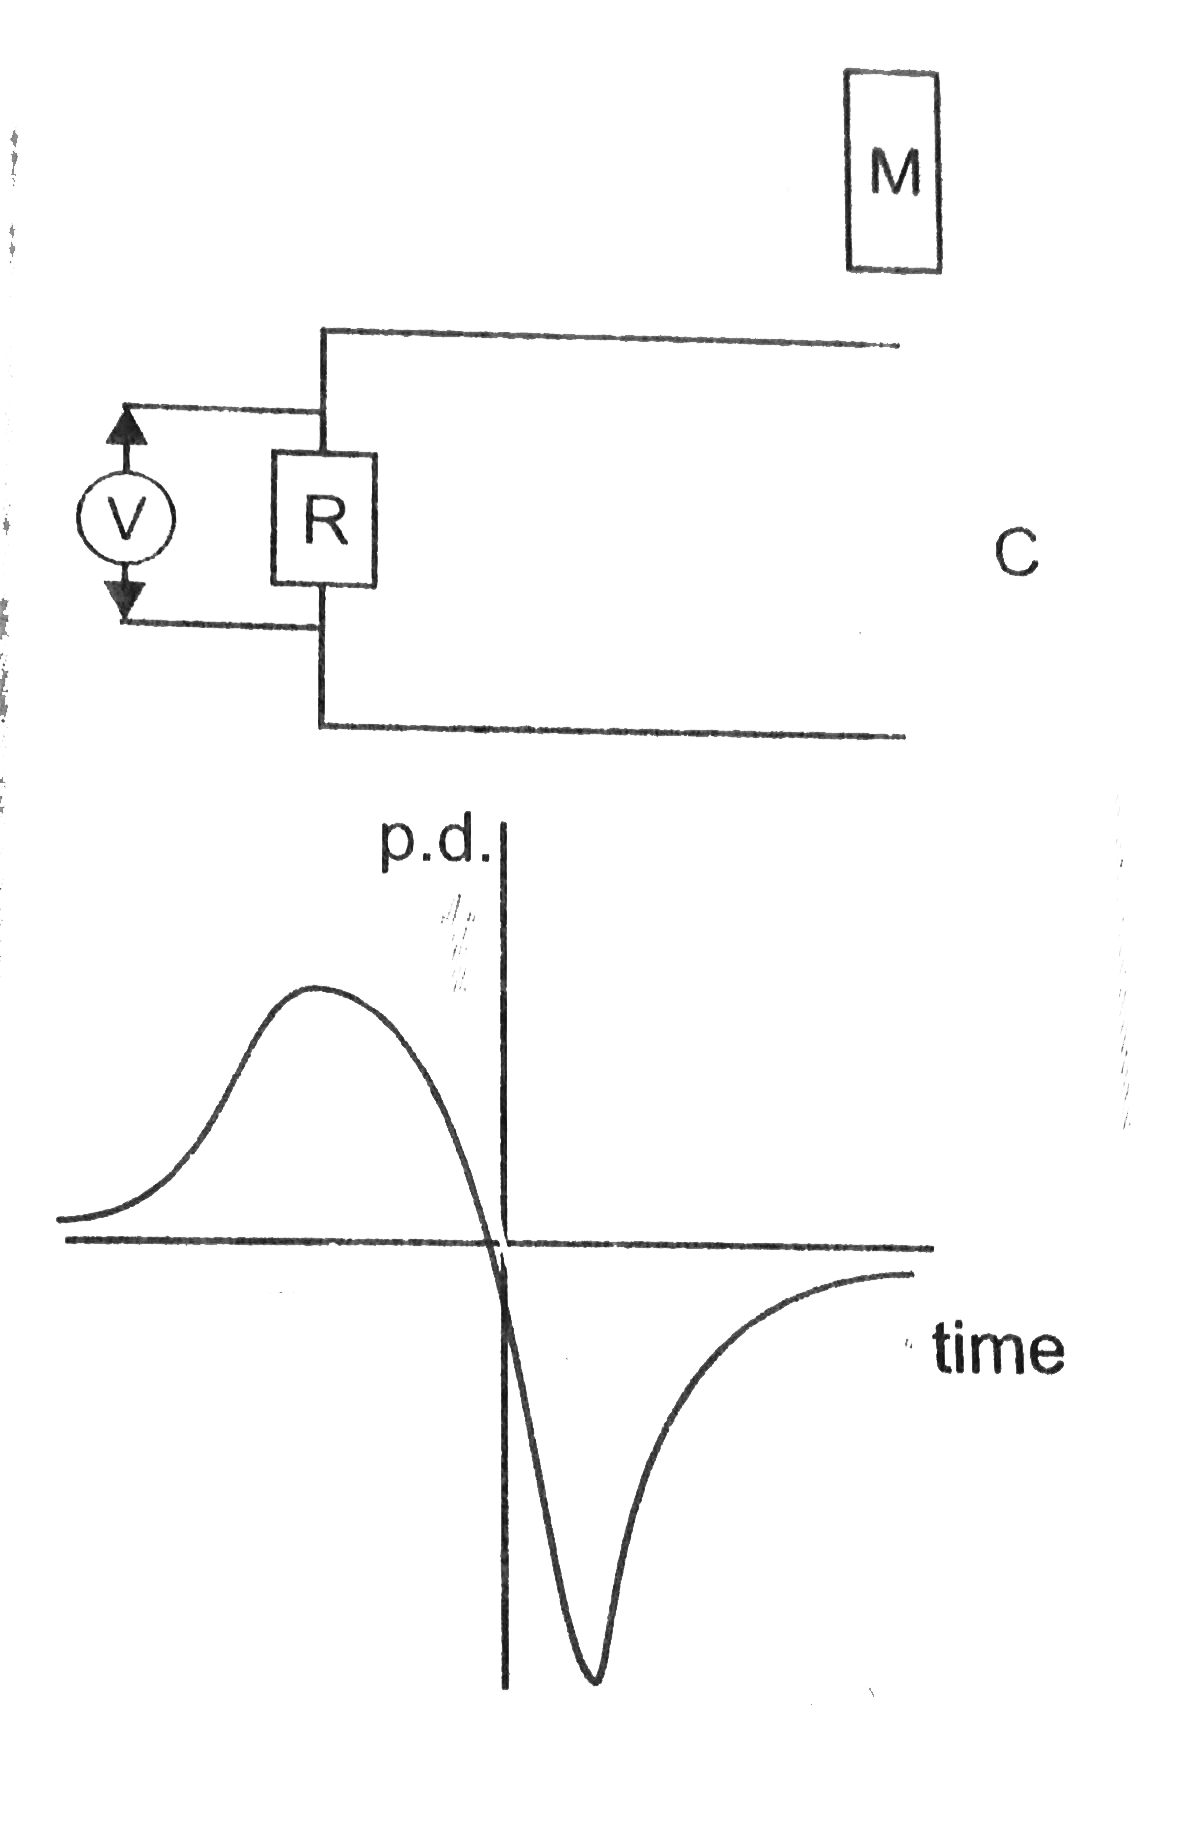
- A bar magnet M is dropped so that if falls vertically through the coil...
Text Solution
|
- A bar magnet M is dropped so that if falls vertically through the coil...
Text Solution
|
- A vertical bar magnet is dropped from from position on the axis of a f...
Text Solution
|
- The graph between the current and the time for an inductance coil is s...
Text Solution
|
- बार ग्राफ का अध्ययन कीजिए और निम्नलिखित प्रश्नों के उत्तर दीजिए। ग्राफ...
Text Solution
|
- बार ग्राफ का अध्ययन कीजिए और निम्नलिखित प्रश्नों के उत्तर दीजिए। ग्राफ...
Text Solution
|
- एक छड़ चुंबक M को एक कुंडली C से ऊर्ध्वाधरतः गिराया जाता है। समय के सा...
Text Solution
|
- A bar magnet is falling with some acceleration ‘a’ along the vertical ...
Text Solution
|
- A bar magnet M is dropped so that is falls vertically through the coil...
Text Solution
|