Text Solution
Verified by Experts


Topper's Solved these Questions
STATISTICS
NAVNEET PUBLICATION - MAHARASHTRA BOARD|Exercise Assignment 6.1|4 VideosSTATISTICS
NAVNEET PUBLICATION - MAHARASHTRA BOARD|Exercise Assignment 6.2|5 VideosSIMILARITY
NAVNEET PUBLICATION - MAHARASHTRA BOARD|Exercise SUBJECTIVE TYPE|20 VideosTHEOREMS
NAVNEET PUBLICATION - MAHARASHTRA BOARD|Exercise CIRCLE|15 Videos
Similar Questions
Explore conceptually related problems
NAVNEET PUBLICATION - MAHARASHTRA BOARD-STATISTICS-EXAMPLES FOR PRACTICE (MCQs)
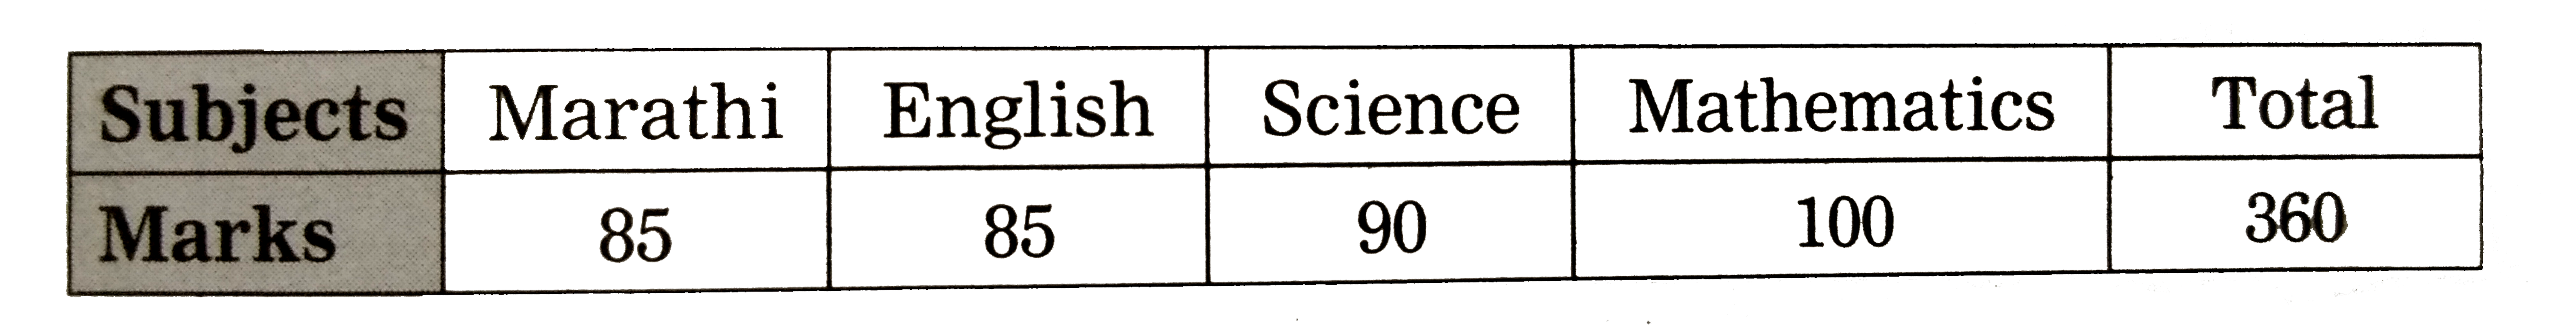
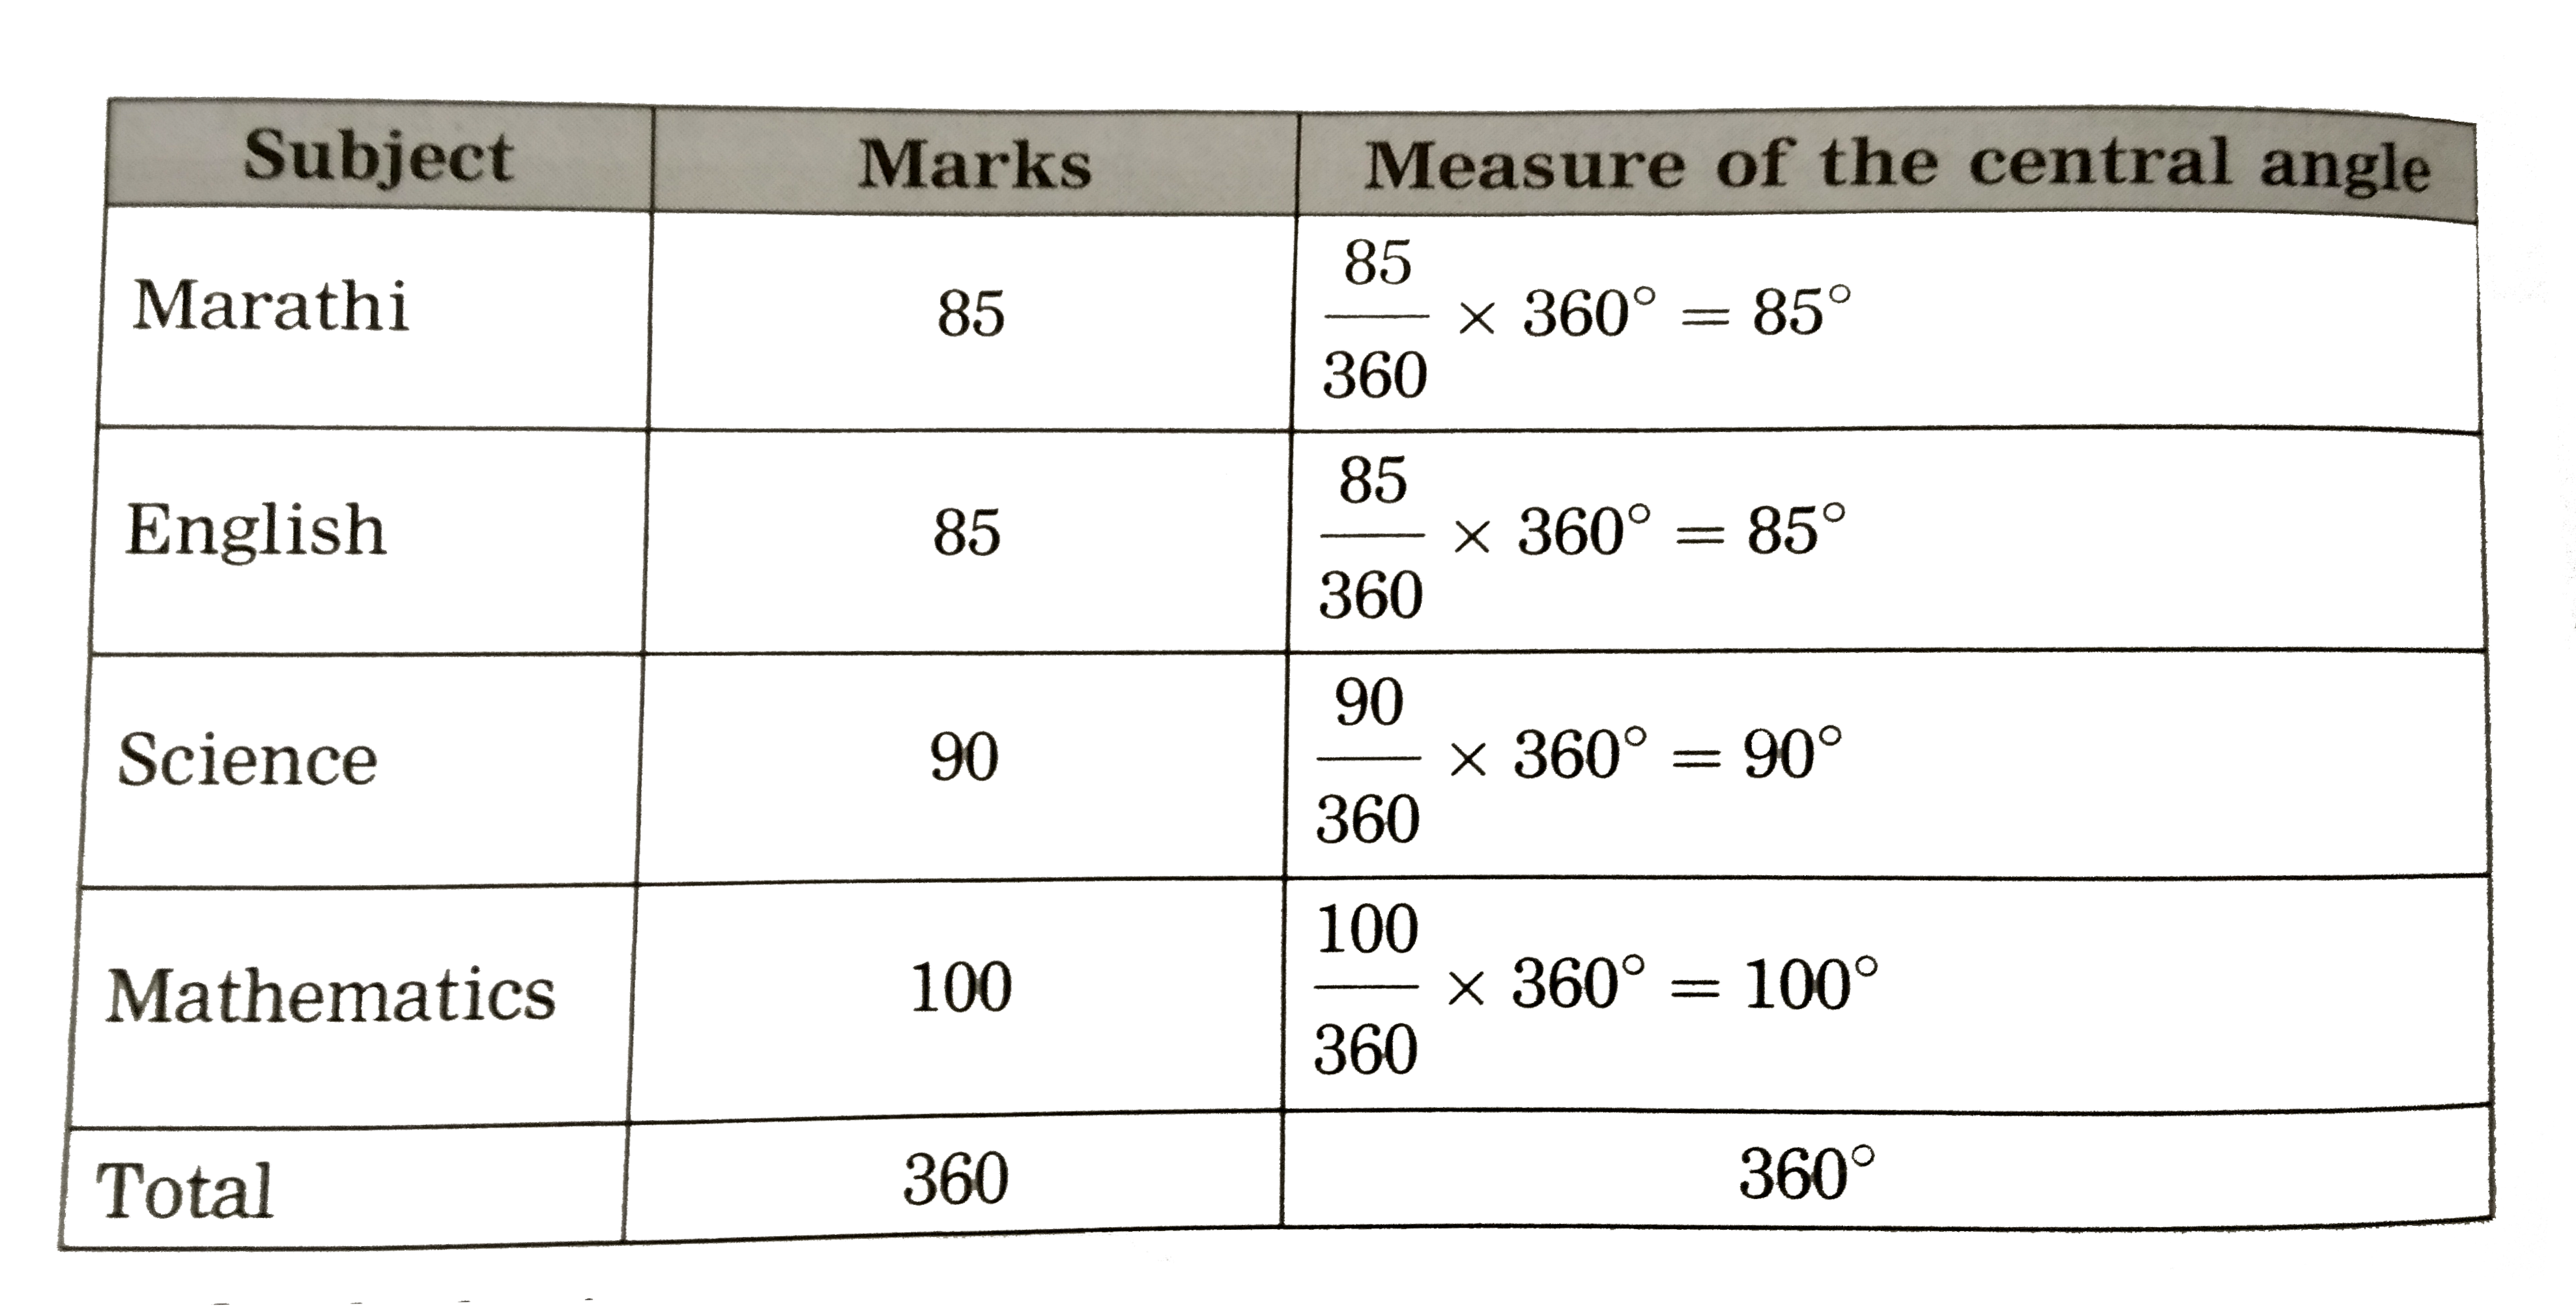
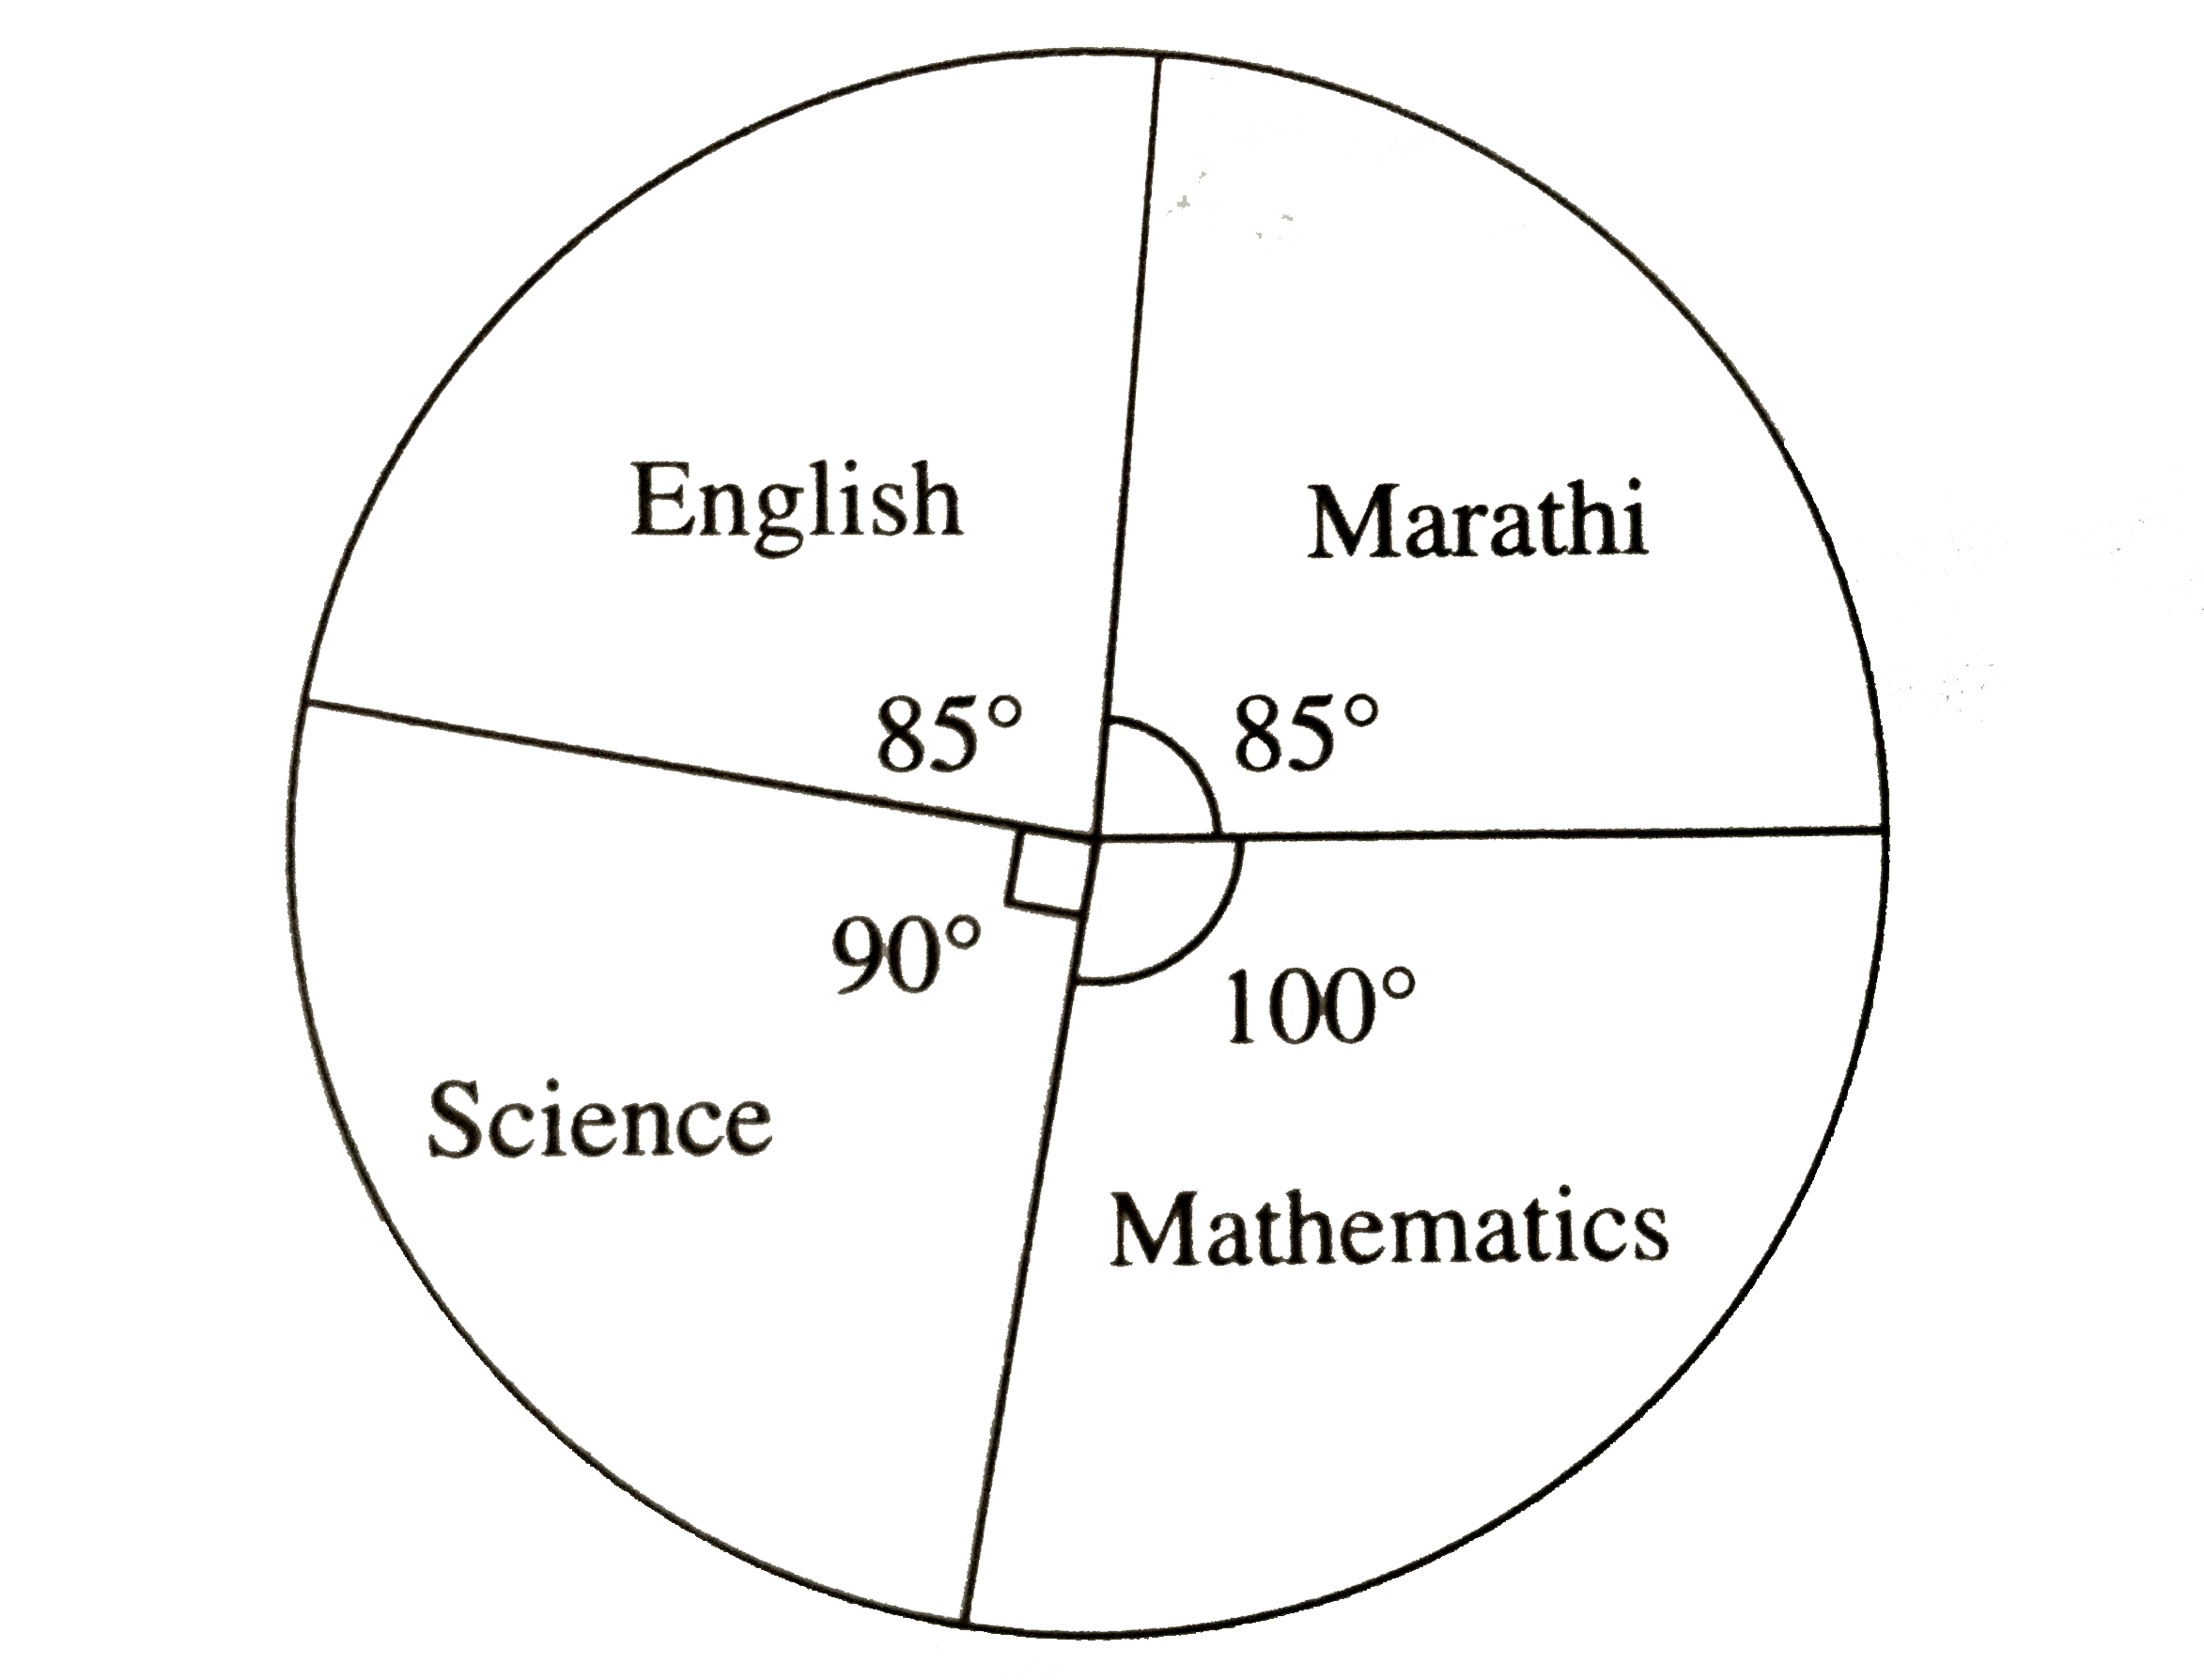
- The marks obtained by a student in an examination are given below : ...
Text Solution
|
- A survey of students was made to know which games they like. The numbe...
Text Solution
|
- The sale by some dealers in a week is represented by a pie diagram. Th...
Text Solution
|
- The class mark of the class 2000-2500 is taken as assumed mean. What i...
Text Solution
|
- In the frequency table showing the amount invested in health insurance...
Text Solution
|
- What is the class mark of the class 100 - 190 ?
Text Solution
|
- Find the value of the mean barX , " if " Sigma f(i) x(i) = 30 " and " ...
Text Solution
|
- Which of the following is the formula for finding mean (bar(X)) by ass...
Text Solution
|
- Method to calculate Mean by Step-Deviation method
Text Solution
|
- Which of the following is not a measure of central tendency
Text Solution
|
- The value of mean is 56.8 " and " Sigmax(i)f(i) = 2840. What is the v...
Text Solution
|
- In a tree plantation programme, 40 students planted various number of ...
Text Solution
|
- Find the class mark of the class 35-39 . What is the next consecutive ...
Text Solution
|
- What is the value of g for the class 200 - 250 ? What is the class mar...
Text Solution
|
- Complete the following activity by filing the boxes : Here, L = ...
Text Solution
|
- Find the value of Sigma f(i) for the following information : (i) Sig...
Text Solution
|
- Find the value of Sigmaf(i) d(i) for the following information. (i) ...
Text Solution
|
- Find the value of bar u for the following information : (i) A = 22.5...
Text Solution
|
- Find the mean of the data given in the following table. {:("Class",0...
Text Solution
|
- The following table shows the percentage of vehicles passing a signal....
Text Solution
|
- The age group of the number of persons in the age group who donated bl...
Text Solution
|