Text Solution
Verified by Experts
The correct Answer is:


Topper's Solved these Questions
STATISTICS
NAVNEET PUBLICATION - MAHARASHTRA BOARD|Exercise EXAMPLES|3 VideosSTATISTICS
NAVNEET PUBLICATION - MAHARASHTRA BOARD|Exercise MISCELLANEOUS|24 VideosSTATISTICS
NAVNEET PUBLICATION - MAHARASHTRA BOARD|Exercise Assignment 6.3|4 VideosSIMILARITY
NAVNEET PUBLICATION - MAHARASHTRA BOARD|Exercise SUBJECTIVE TYPE|20 VideosTHEOREMS
NAVNEET PUBLICATION - MAHARASHTRA BOARD|Exercise CIRCLE|15 Videos
Similar Questions
Explore conceptually related problems
NAVNEET PUBLICATION - MAHARASHTRA BOARD-STATISTICS-Assignment 6.4
- The following table given the percentage distribution of female studen...
Text Solution
|
- Find the median of the following data :
Text Solution
|
- The following table shows frequency distribution of the number of sapl...
Text Solution
|
- The area under different crops in a certain village is given below. Dr...
Text Solution
|
- A survey was conducted in Aadarsh Vidyalaya to know the inclination of...
Text Solution
|
- Draw the histogram to represent the following data.
Text Solution
|
- Represent the following data using a histogram.
Text Solution
|
- The following frequency dsitribution table gives the ages of 80 patien...
Text Solution
|
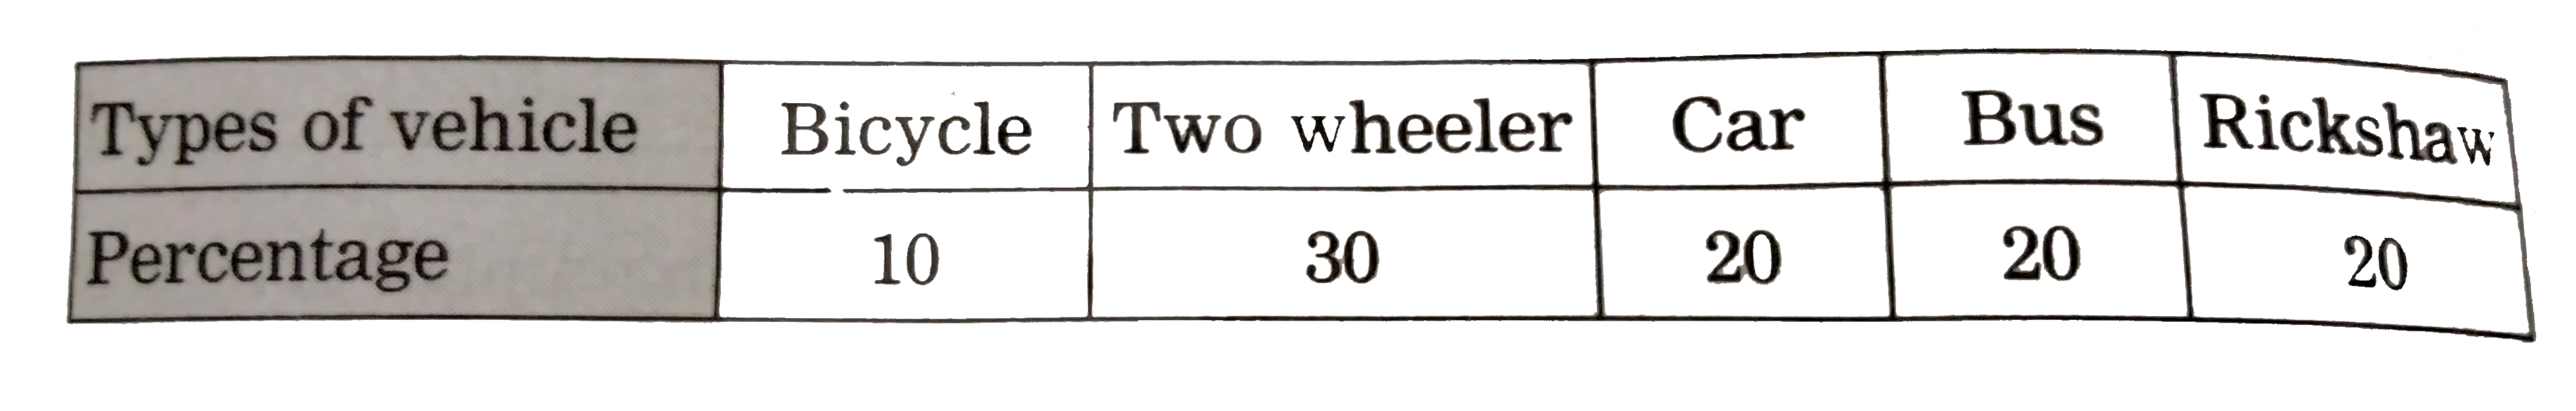
- The following table shows the percentage of vehicles passing a signal....
Text Solution
|