


Similar Questions
Explore conceptually related problems
Recommended Questions
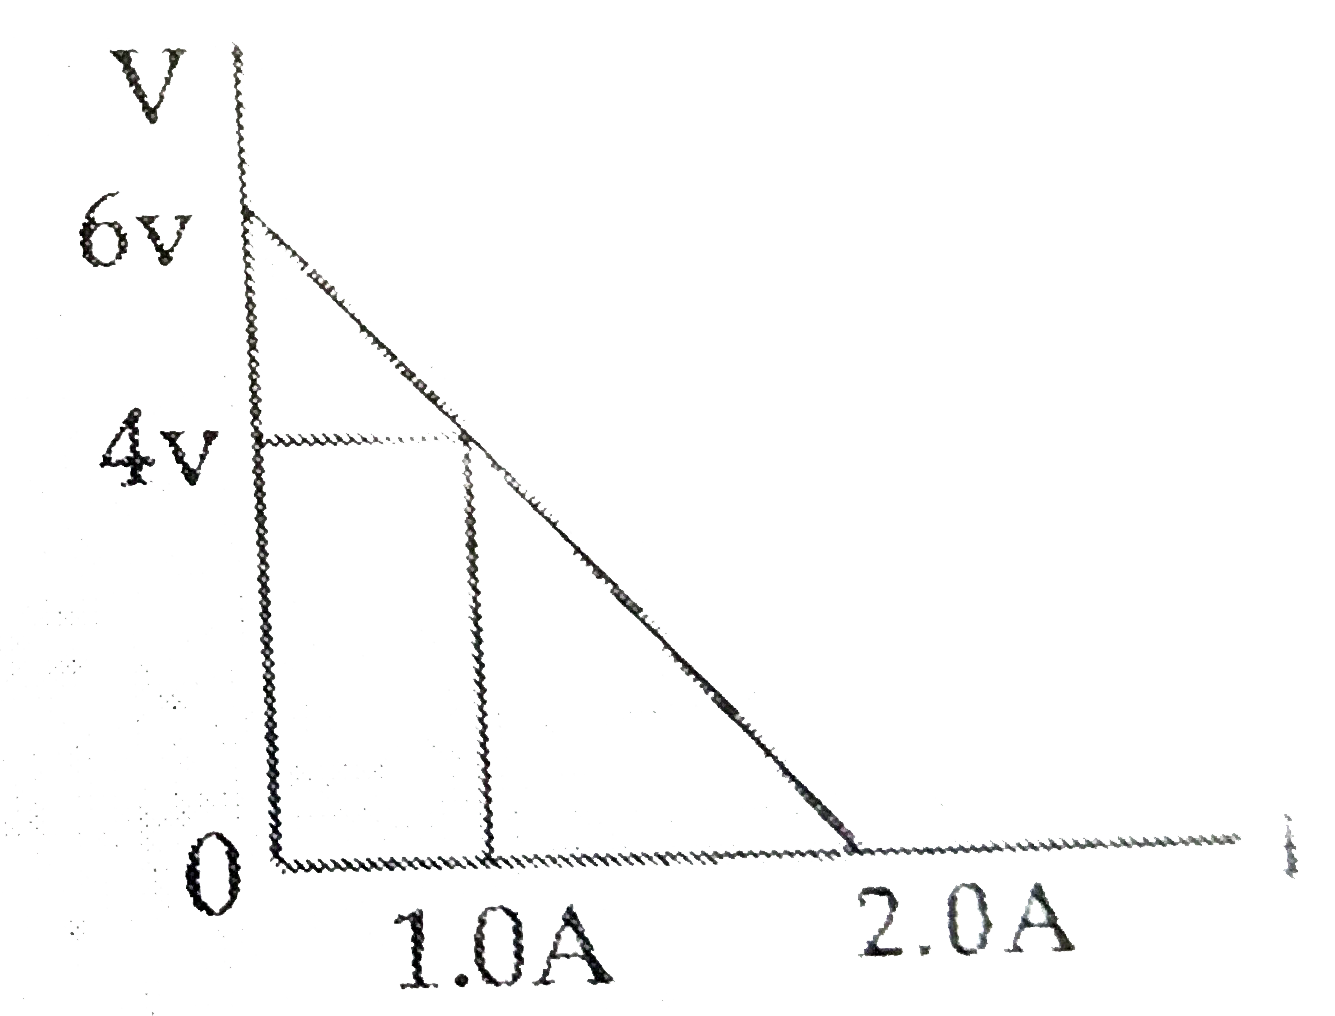
- The figure shows a plot of terminal voltage 'V' verus the current 'I' ...
Text Solution
|
- For a cell, a graph is plotted between the potential difference V acro...
Text Solution
|
- A cell of emf epsilon and internal resistance r is connected across a ...
Text Solution
|
- For a cell the graph between the p.d. (v) across the terminals of the ...
Text Solution
|
- A cell of emf 2V produces 0.3A current when connected to a resistor of...
Text Solution
|
- A cell of emf 1.5 V and internal resistance 0.5 Omega is connected to ...
Text Solution
|
- For a cell, the graph between the potential difference (V) across the ...
Text Solution
|
- The figure shows a plot of terminal voltage 'V' verus the current 'I' ...
Text Solution
|
- A cell of emf E and internal resistance r is connected across a variab...
Text Solution
|