


Similar Questions
Explore conceptually related problems
Recommended Questions
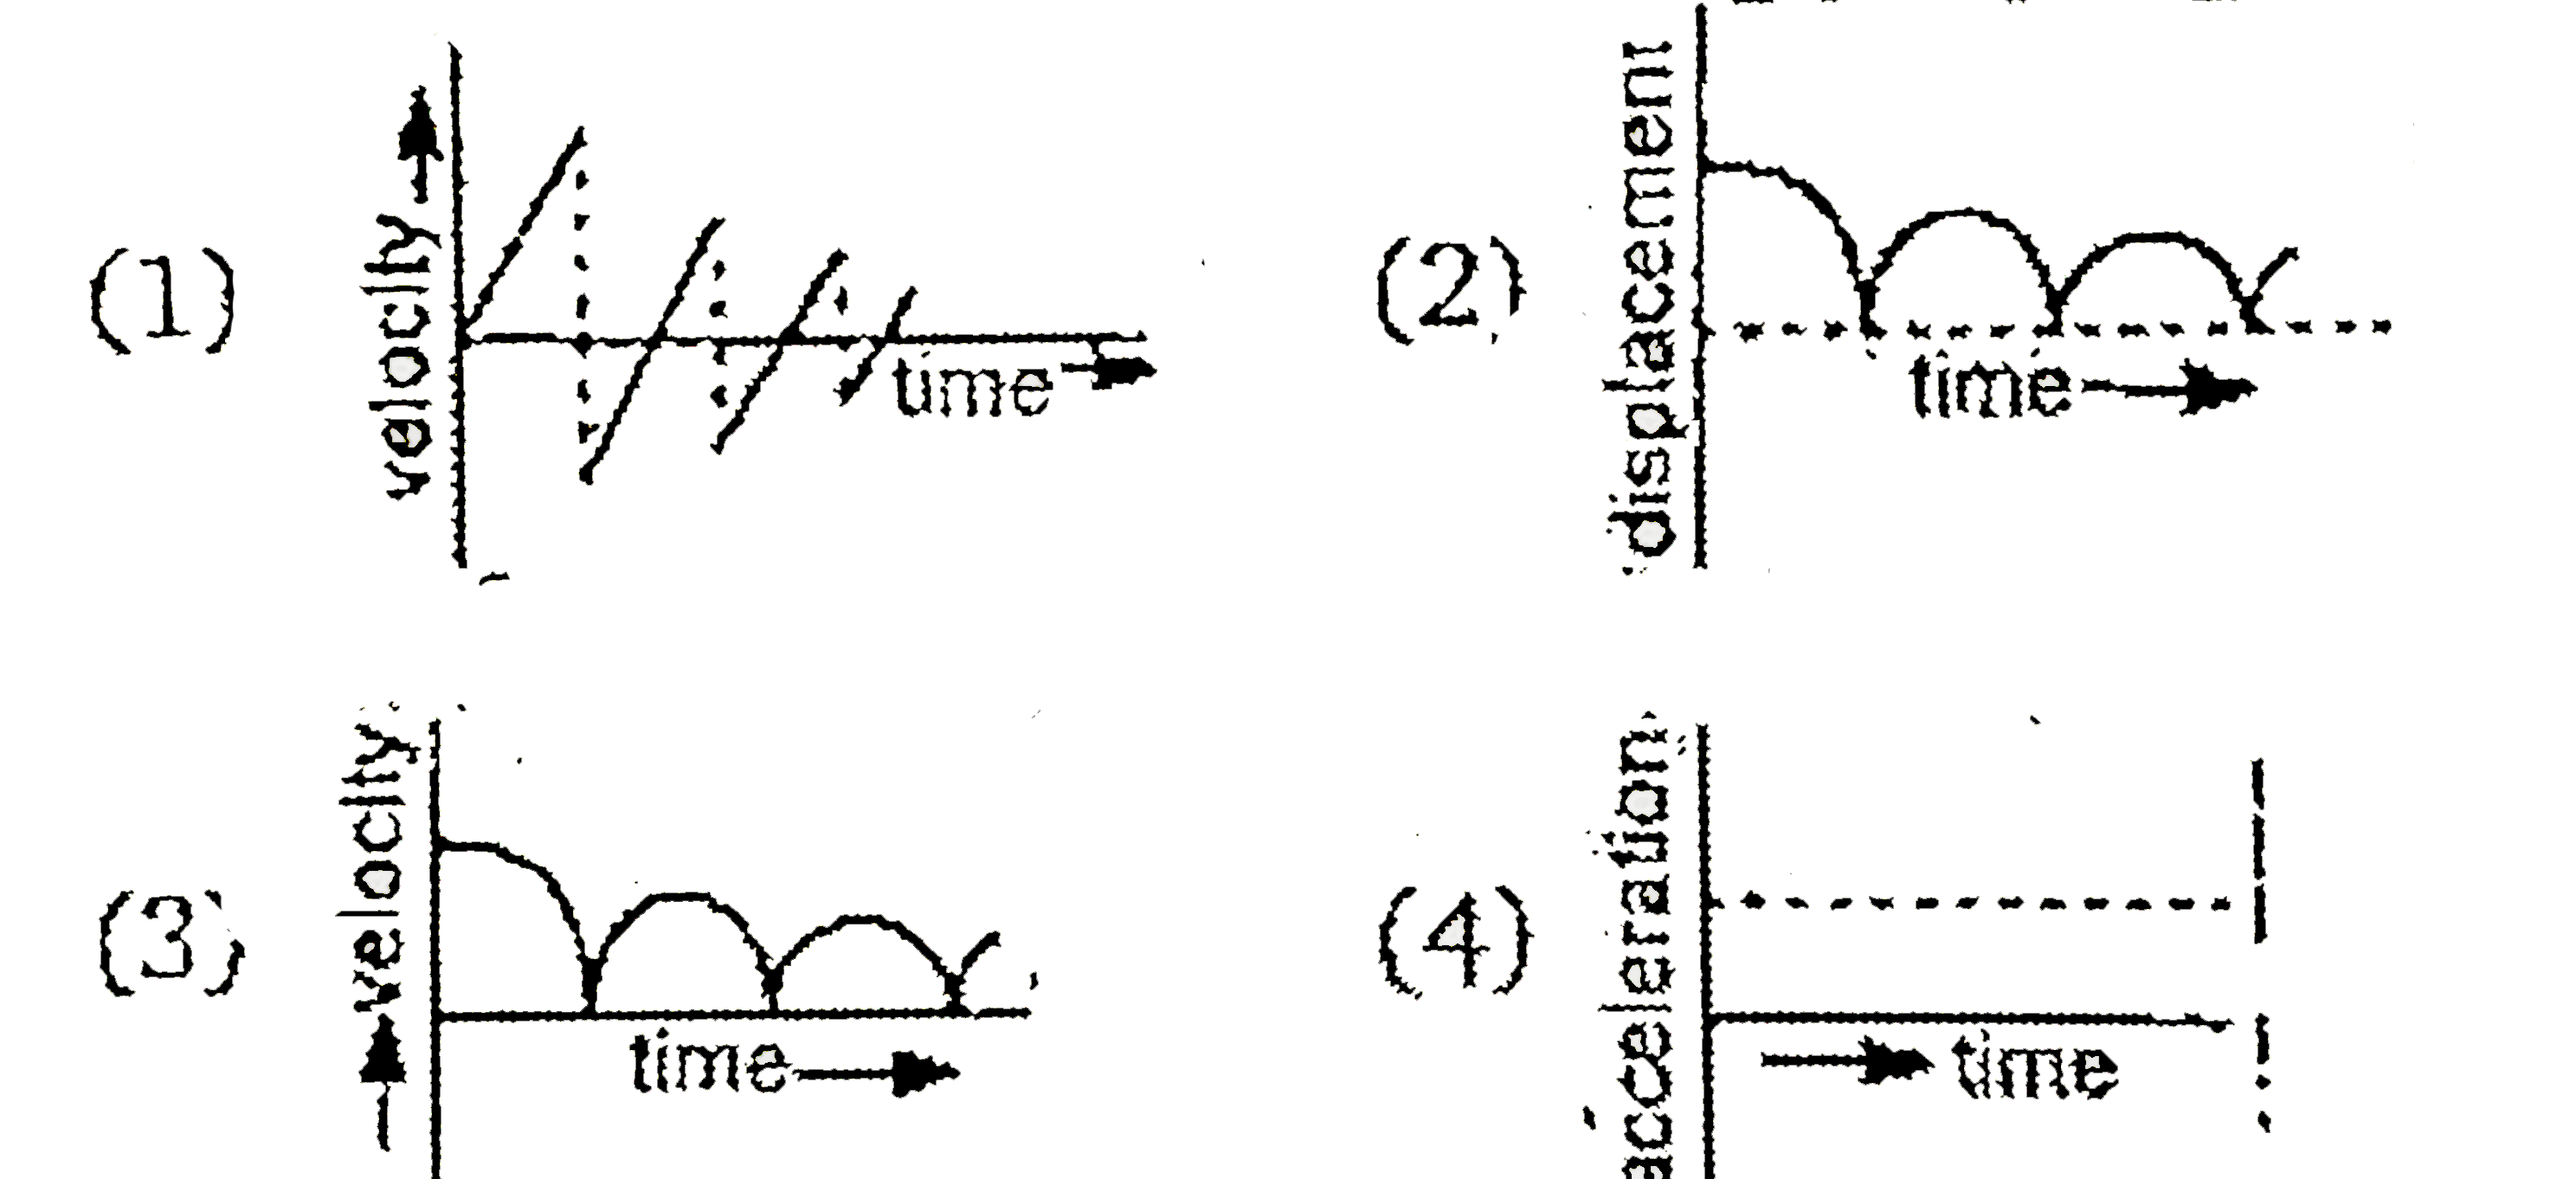
- Select the graph (s) which best represent the graph of bouncing ball. ...
Text Solution
|
- A ball is dropped from a certain height on a horizontal floor. The coe...
Text Solution
|
- A ball of mass 2kg dropped from a height H above a horizontal surface ...
Text Solution
|
- Select the graph (s) which best represent the graph of bouncing ball. ...
Text Solution
|
- A ball is dropped from rest from a height of 0m. If it loses 20% of it...
Text Solution
|
- As part of an experiment, a ball was dropped and allowed to bounce rep...
Text Solution
|
- A ball at rest is dropped from a height of 12 m. It losses 25% of its ...
Text Solution
|
- A glass ball is dropped from height 10 m. If there is 15% loss of ener...
Text Solution
|
- An inelastic ball is dropped from a height 100 meter. If due to impact...
Text Solution
|