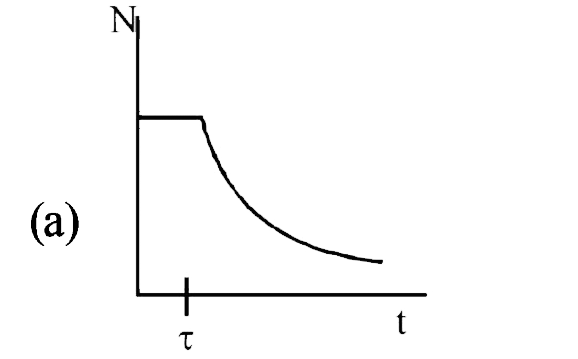
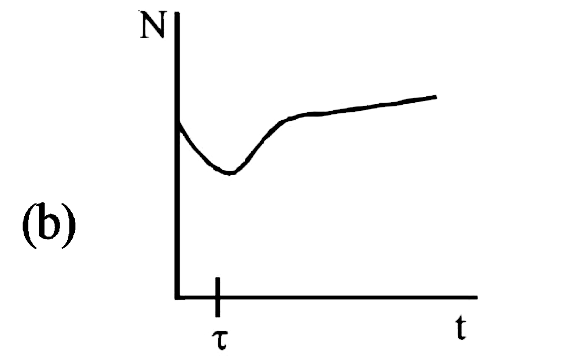
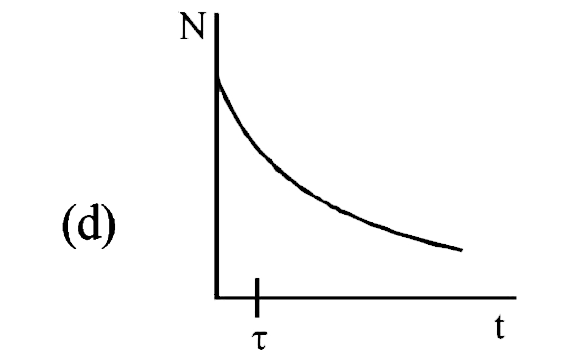
A radicactive sample consider of two distinct species having equial number initially . The mean life time of one species is `tau` and that of the other is `5 tau` . The decay prodects in both cases are stable . A plot is made of the total number of radioactive nuclei as a function of time , which of the following figure best represent the from of this plot?
A
B
C
D
Text Solution
Verified by Experts
The correct Answer is:
D
`N_(1) = N_(oe)^(-lambda _(1) t = N_(0e) ^(t/tau)` ….(i) `as tau = (1)/(lambda_(1))` `N_(2) = N_(0e) ^(-lambda_(2)t) = N_(0e) ^(t/5tau) ` ….(i) as `5 tau = (1)/(lambda_(2))` Adding (i) and (ii) we get `N = N_(1)+ N_(2) = N_(0)(e^(-t//tau) + e^(-t//5 tau) ) (a) in NOT the carrect option as there is a time `tau` for which `N` is constant which means for time `tau` there is no process of radioactivity which does not make same . (b) and (c ) shown intermediate increase in the numberof radicacitive atom which is IMMPOSSIBLE as `N` willl only decrease exponentially.
SUNIL BATRA (41 YEARS IITJEE PHYSICS)|Exercise Comprehension Based Questions|2 Videos
MOVING CHARGES AND MAGNETISM
SUNIL BATRA (41 YEARS IITJEE PHYSICS)|Exercise MCQs(d )|1 Videos
Similar Questions
Explore conceptually related problems
A radioactive sample consists of two distinct species having equal number of atoms initially. The mean life of one species is tau and that of the other is 5 tau . The decay products in both cases are stable. A plot is made of the total number of radioactive nuclei as a function of time. Which of the following figure best represents the form of this plot? (a), (b), (c), (d)
A radioactive substance consists of two distinct having equal number of atoms initially. The mean products in both cases are stable. A plot is made of total number of radioactive nuclei as a function of time. Which of the following figures best represents the form of this plot?
The rate of decay (R ) of nuclei in a radioactive sample is plotted against time (t). Which of the following best represents the resulting curve ?
The rate of decay (R ) of nuclei in a radioactive sample is plotted against time (t) . Which of the following best represents the resulting curve ?
A radioactive sample is a mixture of two radioactive species – one having population N_(1) has a mean life of T_(1) and the other one having population N_(2) has nuclei having mean life of t_(2) . Find the effective mean life of the nuclei in the mixture.
In which of the following case the total number of decays will be maximum in a time interval of t=0 to t=4 hr. The first term represents the number of nuclei at time t=0 and the second represents the half life of the radionuclide:
A radioactive sample consists of two isotopes one of then decays by alpha- emission with a half life of tau_(1)=405s and the other one decays by beta emission with half life of tau_(1) =1620s . At time t=0, probabilities of getting alpha and beta particles from the sample are equal. (a) If a particle coming out of the sample is detected at t=1620s, what is the probability that it is alpha particle? (b) Find the time when total number of surviving nuclei is half the initial quantity. Given If x^(4)+4x-2.5=0 then x=0.59 "log"_(10)2=0.301, "log"_(10)5.9=0.774
A stable nuclei C is formed from two radioactive nuclei A and B with decay constant of lambda_1 and lambda_2 respectively. Initially, the number of nuclei of A is N_0 and that of B is zero. Nuclei B are produced at a constant rate of P. Find the number of the nuclei of C after time t.
SUNIL BATRA (41 YEARS IITJEE PHYSICS)-MODERN PHYSICS-MCQ (One Correct Answer