A
B
C
D
Text Solution
Verified by Experts
The correct Answer is:


Topper's Solved these Questions
Similar Questions
Explore conceptually related problems
DC PANDEY-KINEMATICS-Assertion And Reason
- Assertion : Velocity and acceleration of a particle are given as, v=h...
Text Solution
|
- Assertion : Displacement-time graph is a parabola corresponding to str...
Text Solution
|
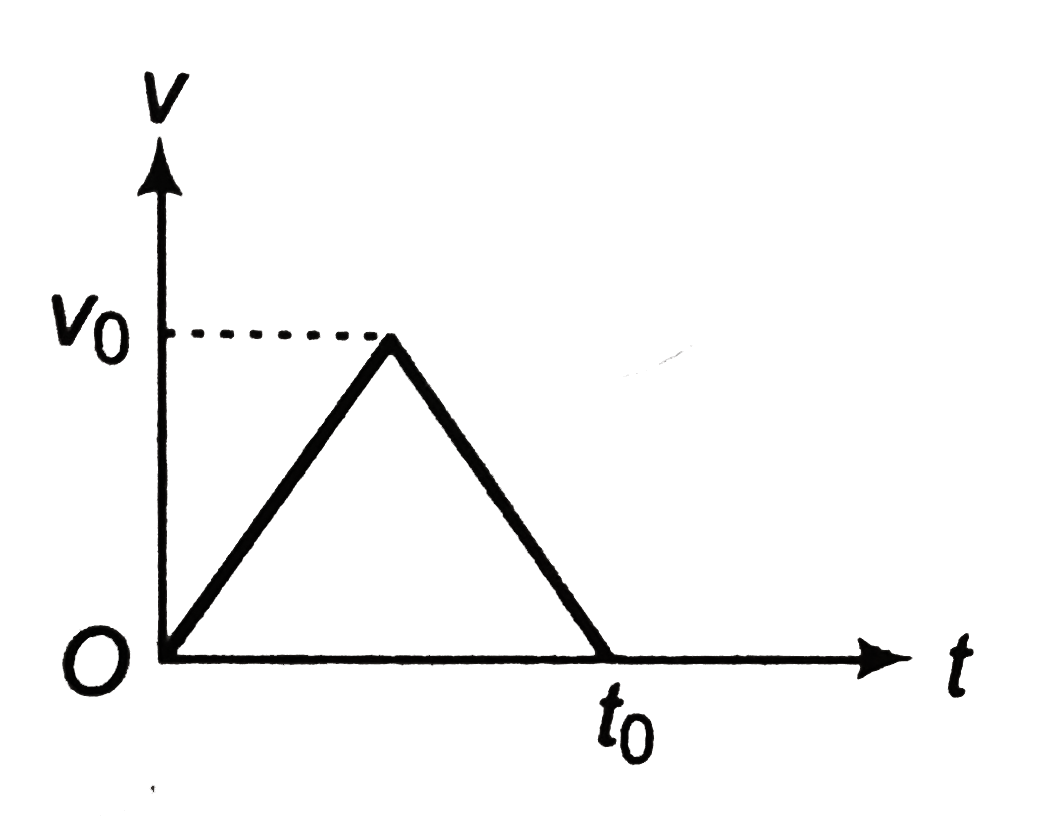
- Assertion : In v-t graph shown in figure, average velocity in time int...
Text Solution
|
- Assertion : We know the relation a = v. (dv)/ds . Therefore, if veloci...
Text Solution
|
- Assertion : Speed of a particle may decrease, even if acceleration is ...
Text Solution
|
- Assertion : Starting from rest with zero acceleration if acceleration ...
Text Solution
|
- Assertion : Average velocity can’t be zero in case of uniform accelera...
Text Solution
|
- Assertion : In displacement-time graph of a particle as shown in figur...
Text Solution
|
- Assertion : Displacement-time equation of two particles moving in a st...
Text Solution
|
- Assertion : Acceleration of a moving particle can change its direction...
Text Solution
|
- Assertion : A body is dropped from height h and another body is thrown...
Text Solution
|
- Assertion : Two bodies of unequal masses m1 and m2 are dropped from th...
Text Solution
|