 .
. Text Solution
Verified by Experts
The correct Answer is:


Topper's Solved these Questions
THERMOMETRY,THERMAL EXPANSION & KINETIC THEORY OF GASES
DC PANDEY|Exercise Example Type 1|1 VideosTHERMOMETRY,THERMAL EXPANSION & KINETIC THEORY OF GASES
DC PANDEY|Exercise Example Type 2|1 VideosTHERMOMETRY THERMAL EXPANSION AND KINETIC THEORY OF GASES
DC PANDEY|Exercise Medical entrance gallary|30 VideosUNIT AND DIMENSIONS
DC PANDEY|Exercise Assertion And Reason|2 Videos
Similar Questions
Explore conceptually related problems
DC PANDEY-THERMOMETRY,THERMAL EXPANSION & KINETIC THEORY OF GASES-Level 2 Subjective
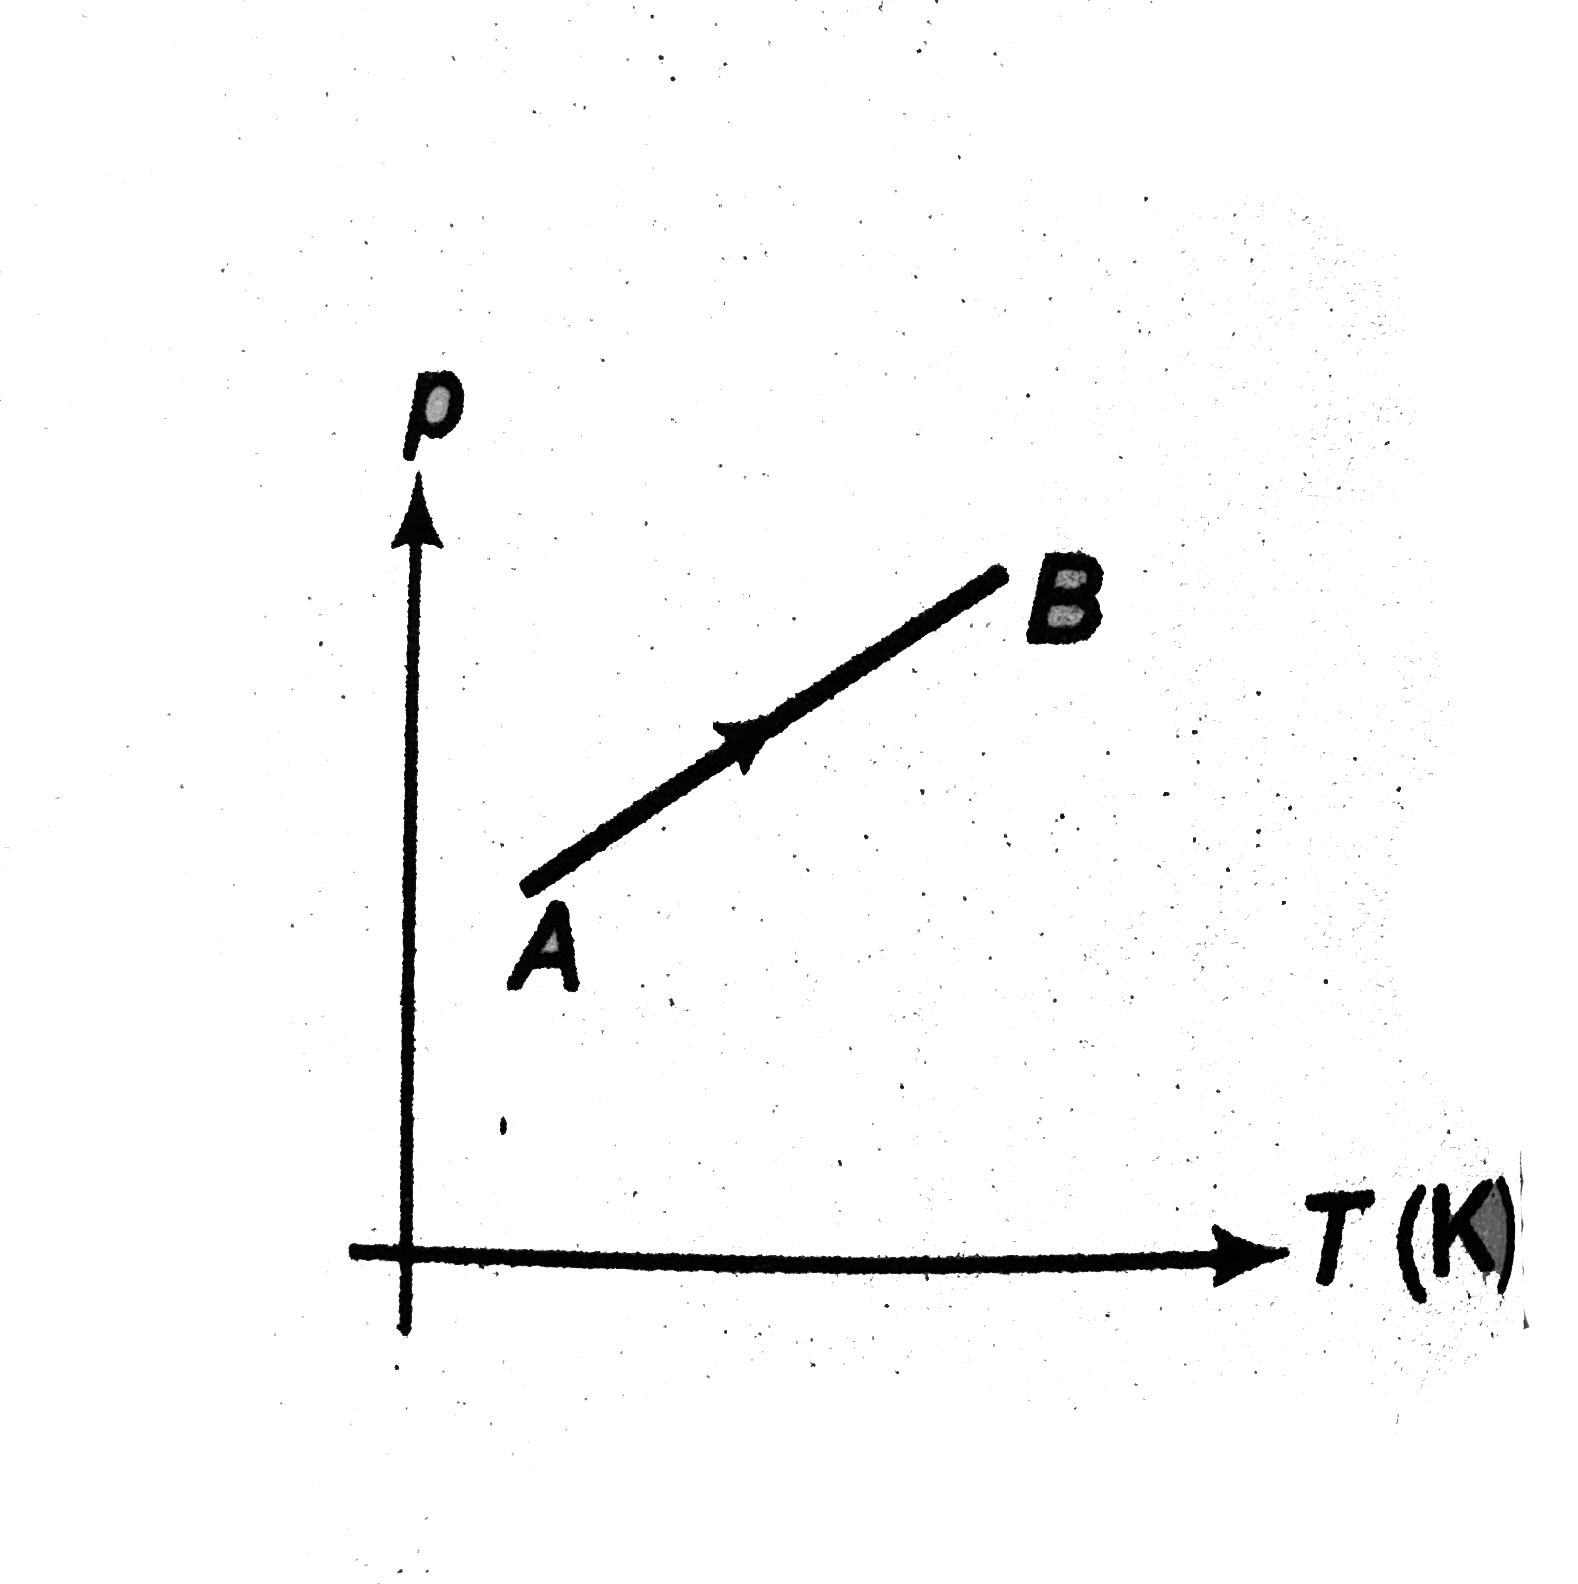
- The p-T graph for the given mass of an ideal gas is shown in figure. W...
Text Solution
|
- Show that the volume thermal expansion coefficient for an ideal gas at...
Text Solution
|
- The volume of a diatomic gas (gamma = 7//5) is increased two times in ...
Text Solution
|
- A perfectly conducting vessel of volume V = 0.4m^3 contains an ideal ...
Text Solution
|
- A thin - walled cylinder of mass (m), height (h) and cross- sectional ...
Text Solution
|
- find the minimum attainable pressure of an ideal gs in the process T =...
Text Solution
|
- A solid body floats in a liquid at a temperature t = 50^@ C being comp...
Text Solution
|
- Two vessel connected by a pipe with a sliding plug contain mercury. In...
Text Solution
|
- Two steel rods and an aluminium rod of equal length l0 and equal cross...
Text Solution
|
- A metal rod (A) of 25 cm length expands by 0.050 cm when its temperatu...
Text Solution
|