Home
Class 11
PHYSICS
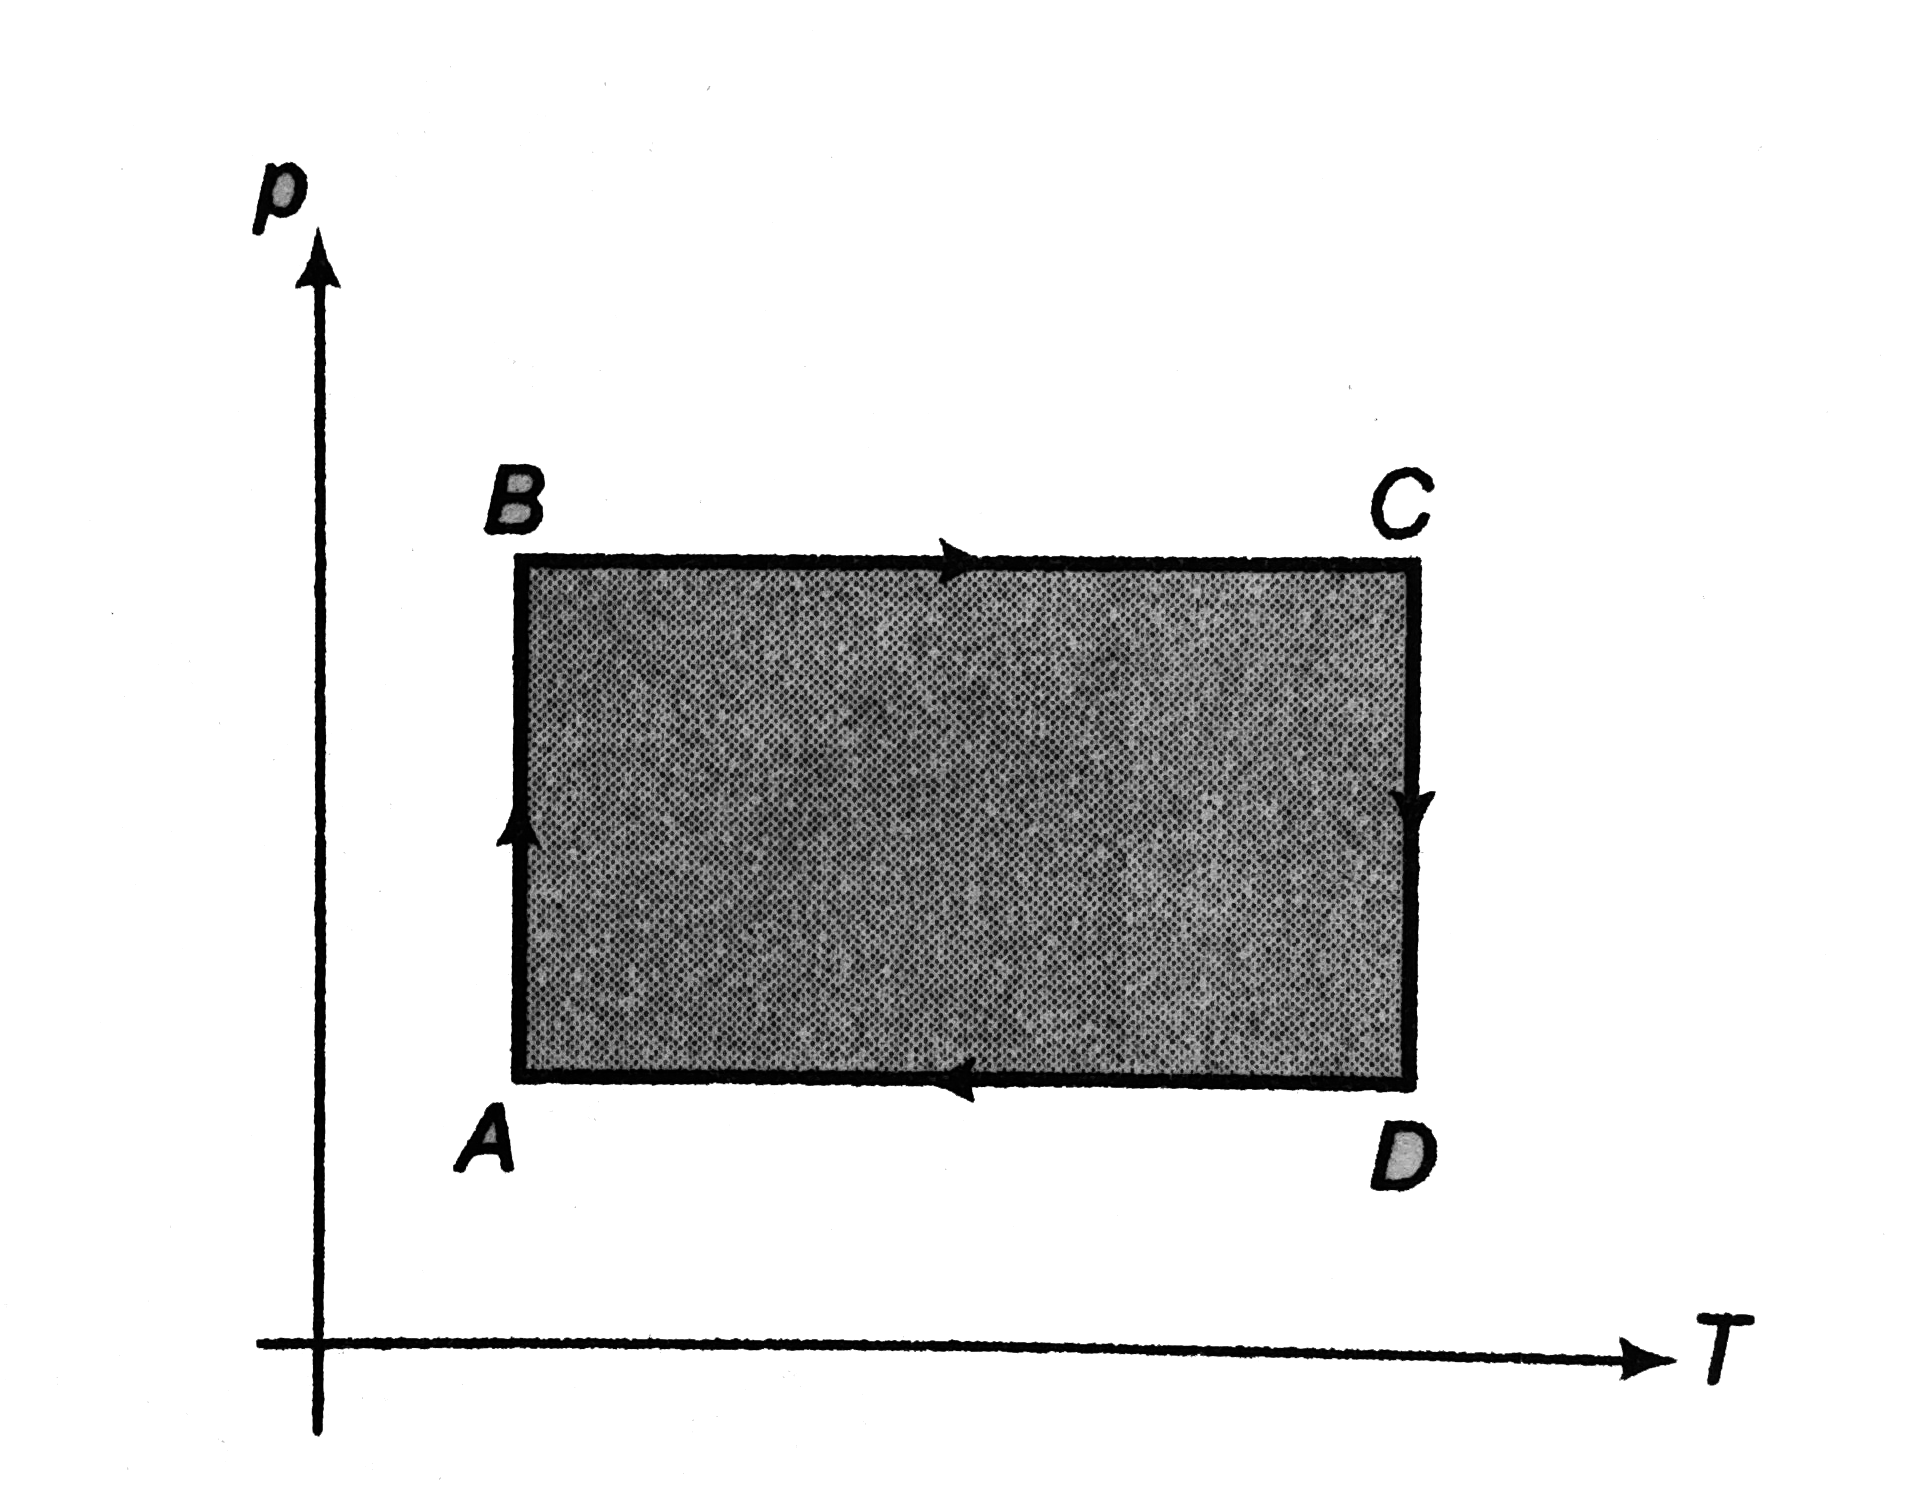
Plot (p - V),(V - T) and (rho - T) graph...

Plot (p - V),(V - T) and (`rho` - T) graph corresponding to the (p - T) graph for an ideal gas shown in figure. .

Text Solution

Verified by Experts

The correct Answer is:
A

Process (AB) is an isothermal process with (T) = constant and `p_(B) gt p_(A)`.
(##DCP_V03_C20_S01_032_S01##).
(p - V) graph : `p prop 1/V "i.e." p - V` graph is a rectangular hyperbola with `(p_B gt p_A)`
and `(V_B lt V_A)`
(V - T) graph : (T - constant). Therefore, (V - T) graph is a straight line parallel to (V - axis) with `(V_B lt V_A)`.
(p - T) graph : `rho = (pM)/(RT)`
or `rho prop p`
As (T) is constant. Therefore, (`rho - T`) graph is a straight the line parallel to (`rho` - axis) with `(p_(A) "as" p_(B) gt p_(A)`.
Process (BC) is an isobaric process with (p = constant)
and `(T_C gt T_B)`
(p - V) graph : As (p) is constant. therefore, (p - V) graph is a straight line parallel to (V - axis) with `(V_C gt V_B)` ( because (V prop T) is an isobaric process)
(V - T) graph : In isobaric process (V `prop` T, i.e V - T) graph is a straight line passing through origin, with `(T_C gt T_B)`
and `(V_C gt V_B)`
(p - T) graph : `(rho prop 1/T` (when (P) = constant) i.e. (rho - T) graph is a hyperbola with `(T_C gt T_B)`
and `(rho _C ltrho _B)`
There is no need of discussing (C - D) and (D - A) processes. As they are opposite to (AB) and (BC) respectively. The corresponding three graphs are shown above.
Promotional Banner

Topper's Solved these Questions

  • THERMOMETRY,THERMAL EXPANSION & KINETIC THEORY OF GASES

    DC PANDEY|Exercise Exercise 20.1|5 Videos
  • THERMOMETRY,THERMAL EXPANSION & KINETIC THEORY OF GASES

    DC PANDEY|Exercise Exercise 20.2|7 Videos
  • THERMOMETRY,THERMAL EXPANSION & KINETIC THEORY OF GASES

    DC PANDEY|Exercise Example Type 3|2 Videos
  • THERMOMETRY THERMAL EXPANSION AND KINETIC THEORY OF GASES

    DC PANDEY|Exercise Medical entrance gallary|30 Videos
  • UNIT AND DIMENSIONS

    DC PANDEY|Exercise Assertion And Reason|2 Videos

Similar Questions

Explore conceptually related problems

Plot P -V, V-T graph corresponding to the P-T graph for an ideal has shown in figure. Explain your answers.

Corresponding to y - t graph of a transverse harmonic wave shown in figure,

The P-T graph for the given mass of an ideal gas is shown in figure. Then the volume

On the P-T graph of an ideal gas, choose the correct option(s):

For V versus T curves at constant pressure P_1 and P_2 for and ideal gas shown in figure-

The ednsity (rho) of an ideal gas varies with temperature T as shown in figure. Then

V vs T curves at constant pressure P_(1) and P_(2) for an ideal gas are shown below Which is correct ?