Text Solution
Verified by Experts


Topper's Solved these Questions
NEWTON'S LAWS OF MOTION 1
CENGAGE PHYSICS|Exercise Exercise 6.2|35 VideosNEWTON'S LAWS OF MOTION 1
CENGAGE PHYSICS|Exercise Exercise 6.3|19 VideosNEWTON'S LAWS OF MOTION 1
CENGAGE PHYSICS|Exercise Solved Examples|11 VideosMISCELLANEOUS VOLUME 2
CENGAGE PHYSICS|Exercise INTEGER_TYPE|10 VideosNEWTON'S LAWS OF MOTION 2
CENGAGE PHYSICS|Exercise Integer type|1 Videos
CENGAGE PHYSICS-NEWTON'S LAWS OF MOTION 1-Exercise 6.1
- Explain why (a) A horse cannot pull a cart and run in empty space. ...
Text Solution
|
- As shown in fig. two identical balls strike a rigid wall with equal sp...
Text Solution
|
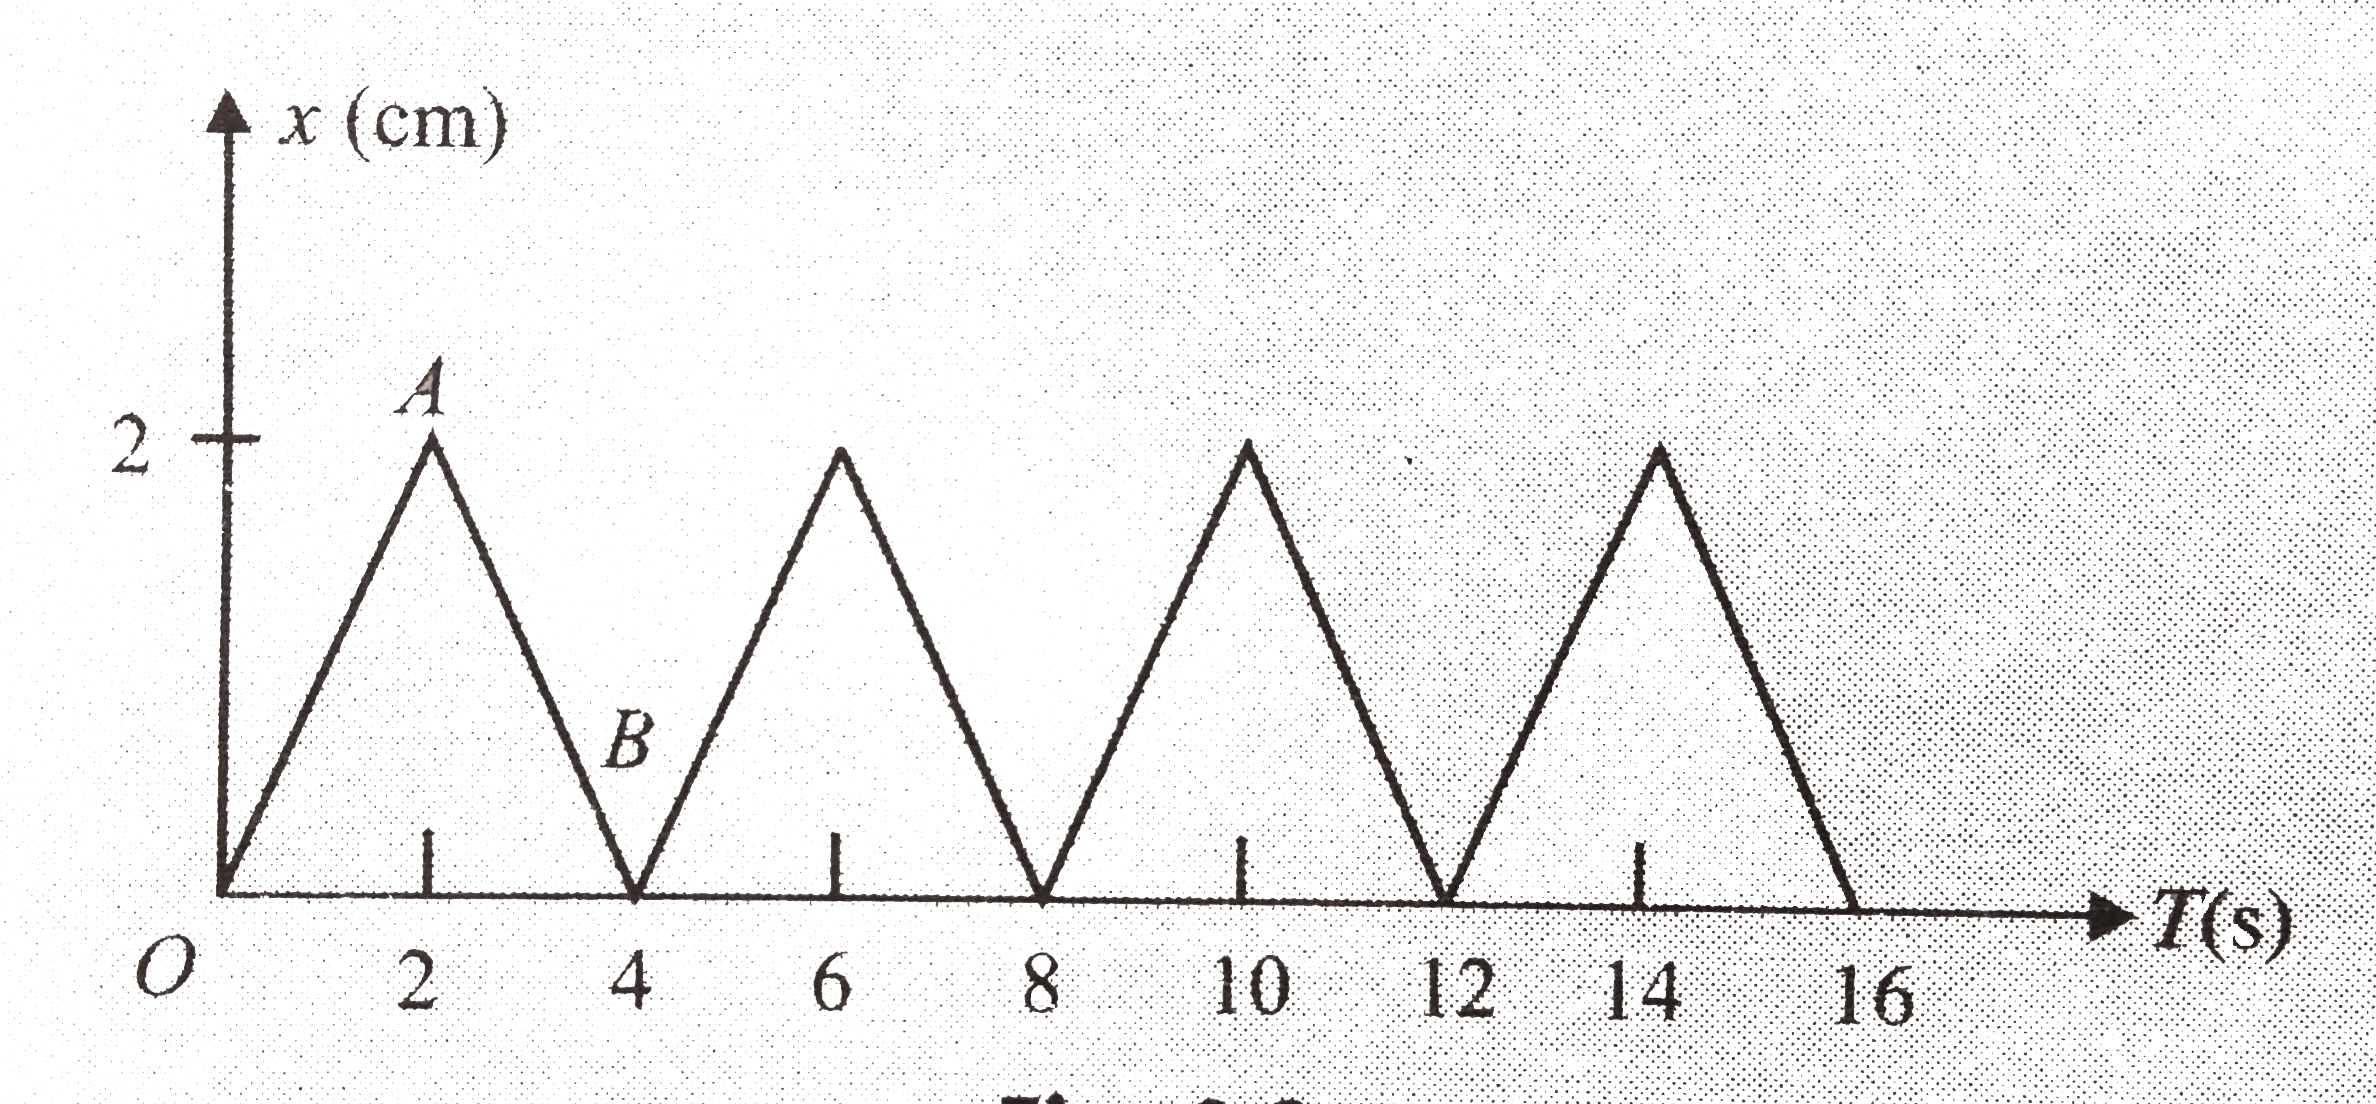
- Figure shows the position-time graph of a particle of mass 0.04kg. Sug...
Text Solution
|
- A rubber ball of mass 50 g falls from a height of 5m and rebounds to a...
Text Solution
|
- Water falls without splashing at a rate of 0.250 Ls^(-1) from a height...
Text Solution
|
- A liquid of density rho is flowing with a speed v through a pipe of cr...
Text Solution
|
- A 3-kg steel ball strikes a wall with a speed of 10.0ms^(-1) at an ang...
Text Solution
|
- The magnitude of the net force exerted in the x direction on a 2.50-kg...
Text Solution
|
- During a heavy rain hailstones of average size 1.0 cm in diameter fall...
Text Solution
|
- A U-shaped smooth wire has a semi-circular bending between A and B as ...
Text Solution
|
- Wind with a velocity 100km h^(-1) blows normally against one of the wa...
Text Solution
|